USE and RED Method
As the world becomes more interconnected and technology continues to offer an increasing number of services, consumers' expectations of those services will also continue to grow. This means that identifying the root cause of problems and doing so quickly will remain important. Without effective monitoring, knowing what to look at, and knowing where to look, catching bottlenecks or failures within your systems can be difficult or even impossible. This is where the USE (Utilization, Saturation, Errors) and RED (Rate, Errors, Duration) methods come into play, offering structured approaches for DevOps teams to monitoring and observability. In this article, we’ll explore these methods and how they can work together to help you maintain reliable systems and improve deployments.
The USE Method
The USE method, developed by Brendan Gregg, is a straightforward and effective approach to monitoring system performance. It focuses on three key metrics: Utilization, Saturation, and Errors. Whether you're an experienced Site Reliability Engineer (SRE) or part of the DevOps team, the USE method can help you quickly identify and troubleshoot performance issues specifically related to hardware.
USE breaks down into three key categories:
- Utilization - The average time that the resource was busy servicing work.
Utilization time you might monitor may include:- CPU Utilization: Track the average time the CPU is busy servicing work. For example, if your server's CPU is busy more than 80% of the time on average, it might indicate the need to add more processing power.
- Memory Utilization: Observe the average time memory is occupied by applications. High memory utilization, where memory is busy most of the time, could suggest the need for additional RAM or optimizing your applications.
- Saturation - How much workload your system is handling beyond its capacity. It reflects the amount of work waiting to be processed.
Saturation metrics you might monitor may include:- Queue Lengths: Look at the length of queues for resources like CPUs and disks. Long queues indicate that resources are saturated and can't handle additional work promptly.
- Input/Output Wait Times: Check how long tasks are waiting for input/output operations to complete. High wait times can signal saturation.
- Errors - Counts the number of problems or failures occurring in the system.
Errors you might monitor may include:- System Errors: Monitor for hardware errors, disk read/write errors, and other system-level issues. Frequent errors can indicate failing hardware or misconfigurations that need addressing.
- Application Errors: Look for errors in system logs that might point to issues with your applications or services.
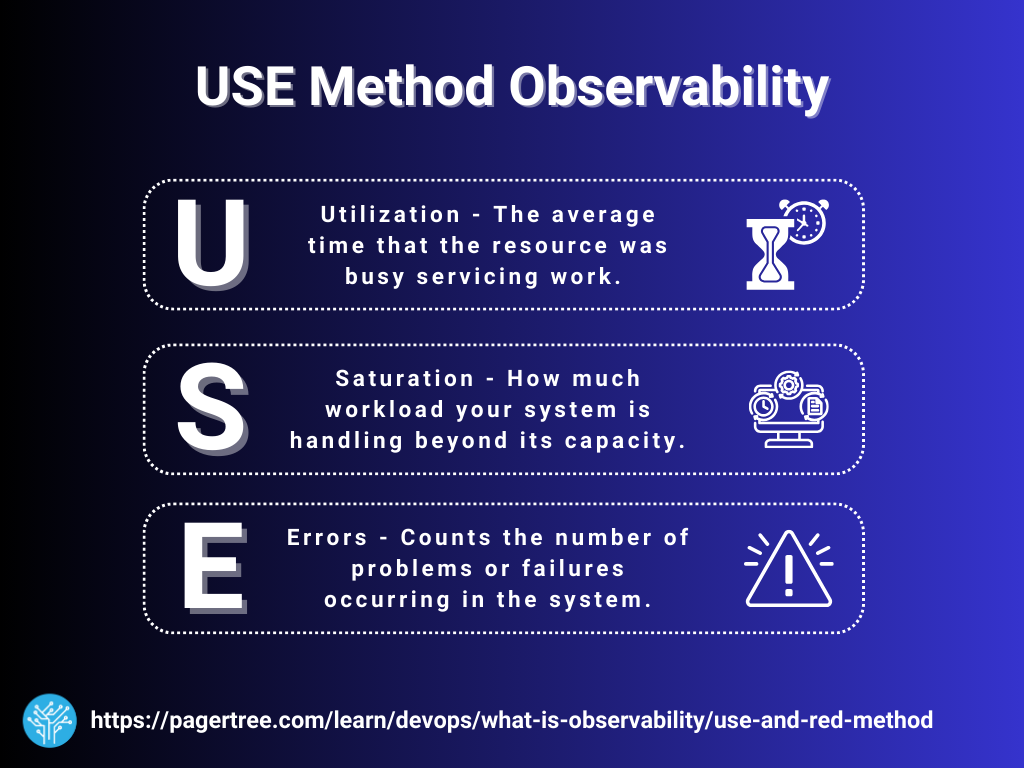
USE Method Observability Acronym
The RED Method
The RED method, introduced by Tom Wilkie, is a powerful approach for monitoring the performance of microservices. It focuses on three key metrics: Rate, Errors, and Duration. This method is simple enough for beginners to understand and detailed enough to provide experienced SREs with valuable insights into their systems. The RED method specifically helps troubleshoot services-related issues.
RED breaks down into three key categories:
- Rate - Measures the number of requests your service is handling per second.
Rate metrics you might monitor may include:- Request Rates: Track the number of requests per second your services handle. For example, measure the rate of API calls to determine if your service can handle the load.
- Throughput: Measure the amount of data processed over time, such as bytes per second, to understand the demand on your network or storage.
- Errors - Counts the number of failed requests.
Errors you might monitor may include:- Failed Requests: Monitor the number of failed requests, such as HTTP 500 errors. High error rates can indicate issues with your service that need fixing.
- User Complaints: Track the number of user-reported issues, which can help identify problems not immediately visible through system metrics.
- Duration - Measures how long it takes to process a request.
Duration types you might monitor may include:- Response Times: Check how long it takes for your service to respond to requests. Slow response times can frustrate users and indicate performance bottlenecks.
- Latency: Measure the time taken for data to travel across your network. High latency can affect the performance of your services.
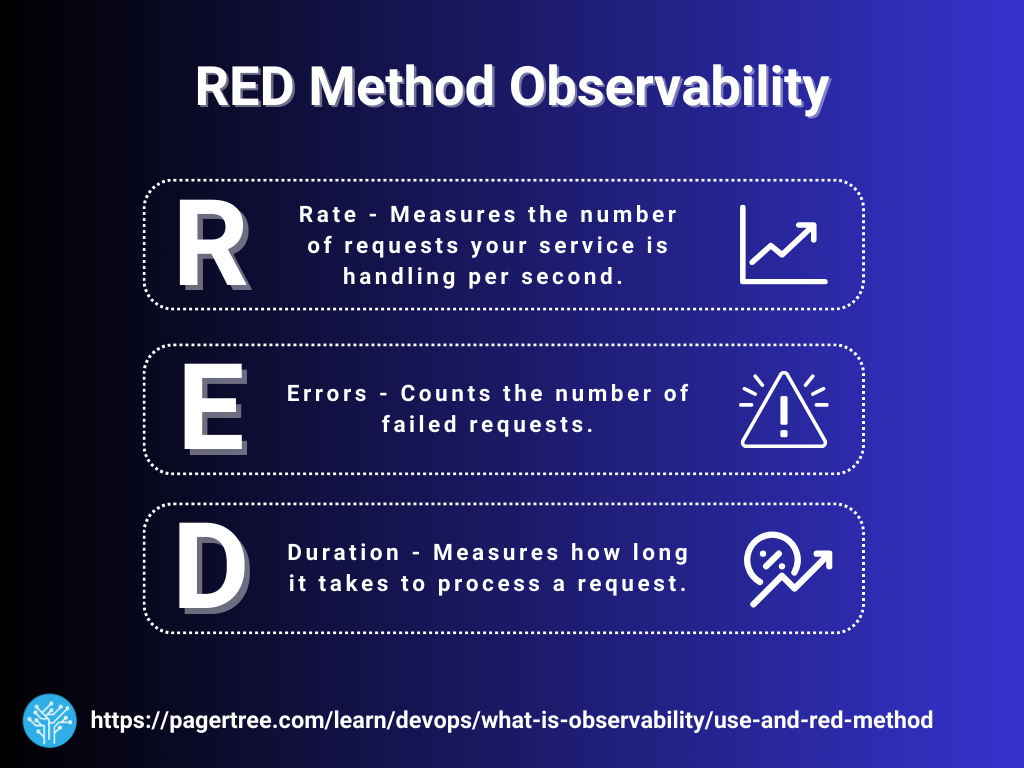
RED Method Observability Acronym
Tom Wilkie RED Method
Tom Wilkie of GrafanaLabs did a great talk on these at GrafanaCon EU 2018.
USE and RED Methods: How They Work Together
The USE (Utilization, Saturation, Errors) and RED (Rate, Errors, Duration) methods are both important for comprehensive system observability. While the USE method focuses on the health of your resources, the RED method zeroes in on the performance of your services. Using these methods together provides an all-inclusive view of your system's performance and health, enabling you to troubleshoot issues more effectively, reducing downtime, and optimizing both infrastructure and applications. You can monitor metrics encompassed by both methods with system monitoring tools like Prometheus or Datadog. Partner these powerful monitoring tools with oncall alerting tools like PagerTree to stay informed when systems operate outside of parameters.
Benefits of Combined Monitoring
- Early Detection - Combining both methods helps detect issues early by providing a full picture of system health and performance. Early detection of issues helps maintain customer SLAs and internal SLOs.
- Root Cause Analysis - When an issue arises, you can quickly identify whether it's due to infrastructure limitations (USE) or service performance issues (RED).
- Optimized Performance - Regularly monitoring both sets of metrics ensures that both your hardware and software components are running efficiently, providing the best possible experience for users.
By understanding where to look and what to look for, you can ensure your systems are operational and optimized for performance and reliability. USE and RED outline a comprehensive yet simple approach to superior system observability, giving you the best foundation for success.
\
\