👑 What is System Monitoring?

As service providers, we understand that 100% uptime for our service isn't an achievable goal, but we do everything in our power to provide our customers with the best possible service and highest availability possible. We implement tools and processes to allow ourselves the ability to respond to issues before they affect our customers. One type of tool we implement is system monitoring tools. The tools give us observability for all of our systems. Access to all of our systems in a clean, easy-to-read dashboard helps us see trends and issues before they become serious problems. Understanding our systems and resolving issues before our customers see them helps improve customer satisfaction and service uptime and helps us meet our SLAs, but what is system monitoring?
System monitoring, also known as “application performance monitoring” (APM), is the process of tracking and evaluating the performance and health of a service provider’s infrastructure.
Monitored systems can include:
- Servers
- Networks
- Applications
- Configurations
APM tools allow system administrators to instrument, collect, and analyze crucial operational insights to keep systems operating at their peak.
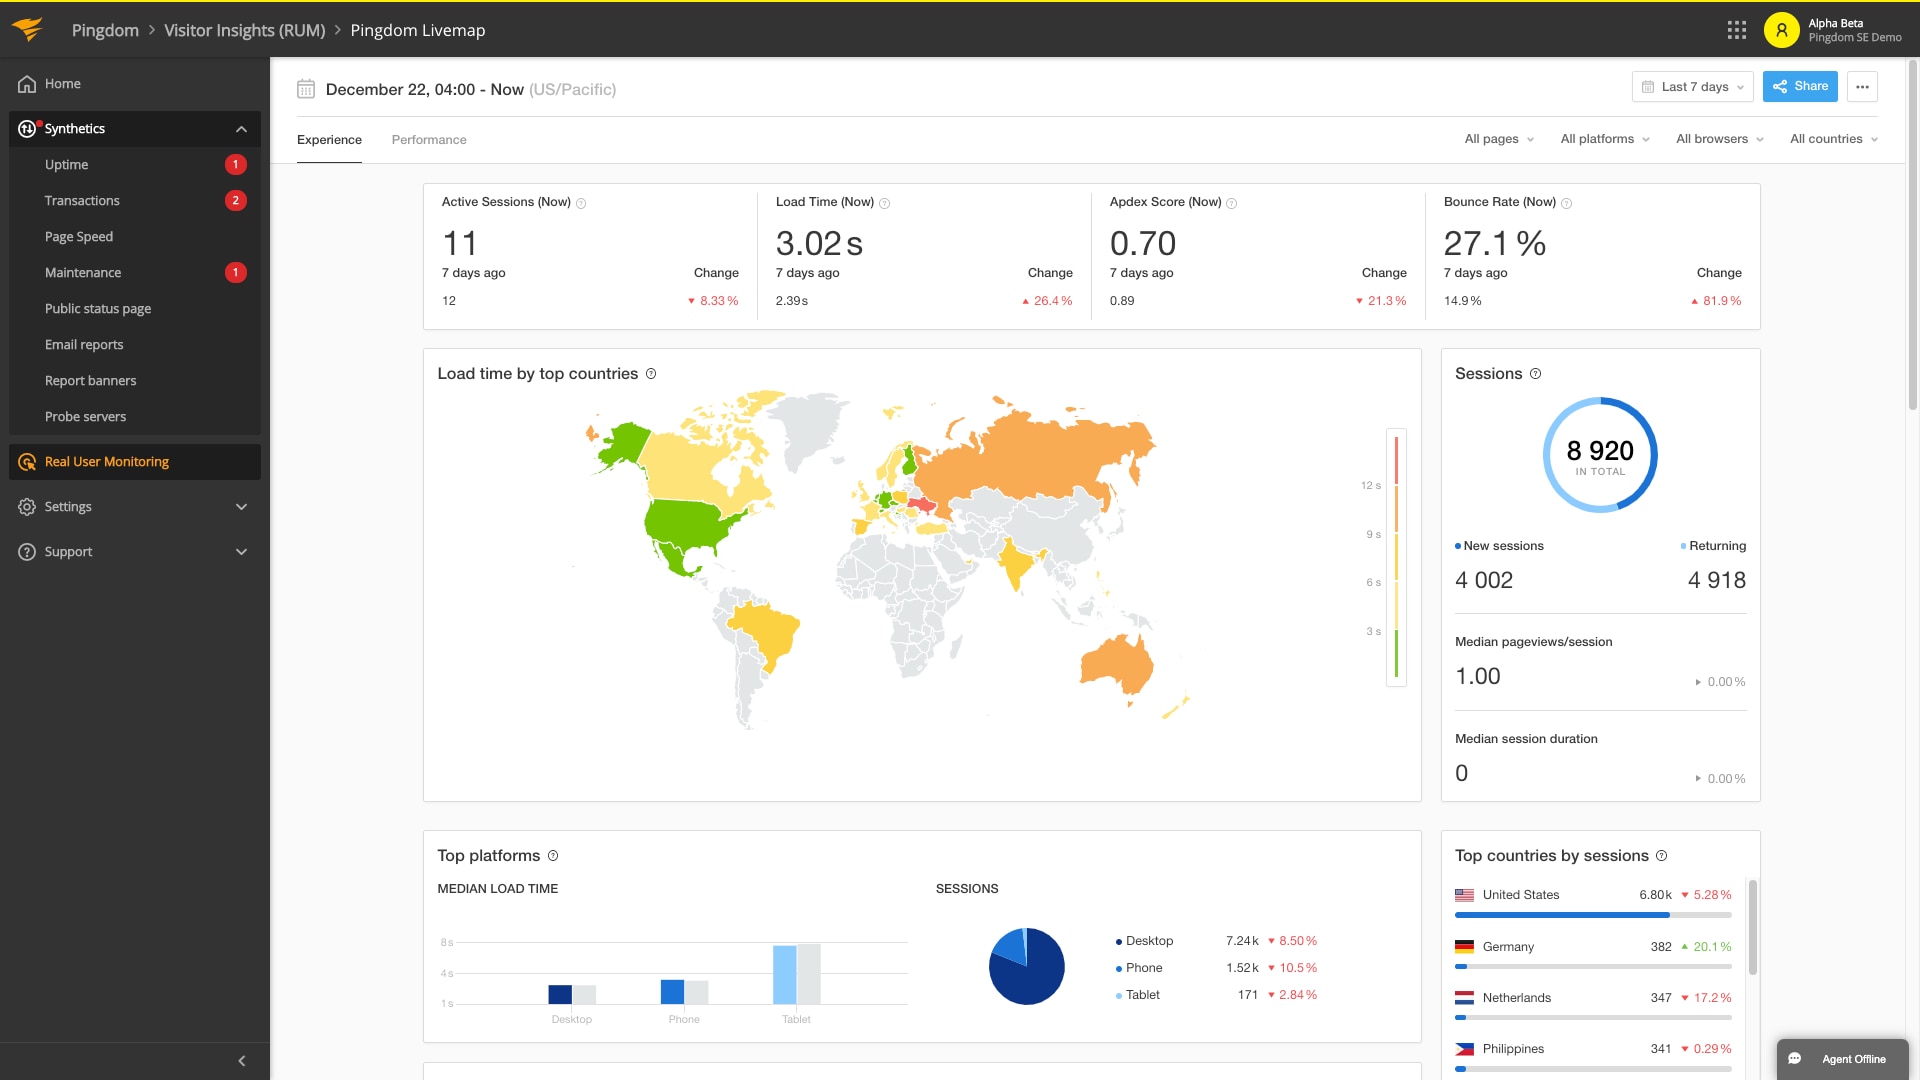
-8113a339941413bd142a9bd41ee1bcfd.png)
What do System Monitors actually Monitor?
7 Best APM Tools
We have compiled a list of the top 7 industry-leading system monitoring tools using 5 key factors to evaluate and scrutinize APM tools.
Here are the top 7 APM tools using our key criteria:
What To Look For In Your System Monitoring Software
When evaluating an APM tool, consider these 5 key factors to ensure you are picking the right tool to monitor your systems.
- Reliability: Monitoring software's primary role is to provide consistent and accurate data on your system's health and performance. The software should have a proven track record of minimal downtime and accurate measurement, reporting, and alerting.
- Scalability: APM tools must be able to grow with your service, handling an increasing number of devices and metrics without a drop in performance.
- Integrations: The monitoring system you choose should easily fit into your existing technology stack. Its ability to integrate smoothly with other tools and platforms can significantly enhance its utility and the benefits you gain from it.
- Pricing: APM tools range in pricing anywhere from free to hundreds of dollars. Pricing should align with your budget and the value it delivers. Look for transparent pricing models that scale sensibly with your usage. -Ease of use: System monitoring software should provide a user-friendly interface, clear documentation, and responsive customer support. This will dramatically improve the experience of setting up and maintaining your monitoring solution.
Datadog: Modern Monitoring & Security
Datadog Logo
Datadog is a widely used application performance monitoring tool, thanks to its extensive list of over 700 built-in integrations that make it highly adaptable for any stack. The company promises a 99.8% uptime, ensuring its tools are available when you require them the most. Datadog is unmatched in the services it provides, encompassing everything from log management to full infrastructure monitoring.
They champion their “AI-powered code level distributed tracing tool, Watchdog,” which enables users to “detect and resolve root causes faster,” improving application performance and security. This Watchdog AI automates root cause analysis, helps detect anomalies, and minimizes downtime.
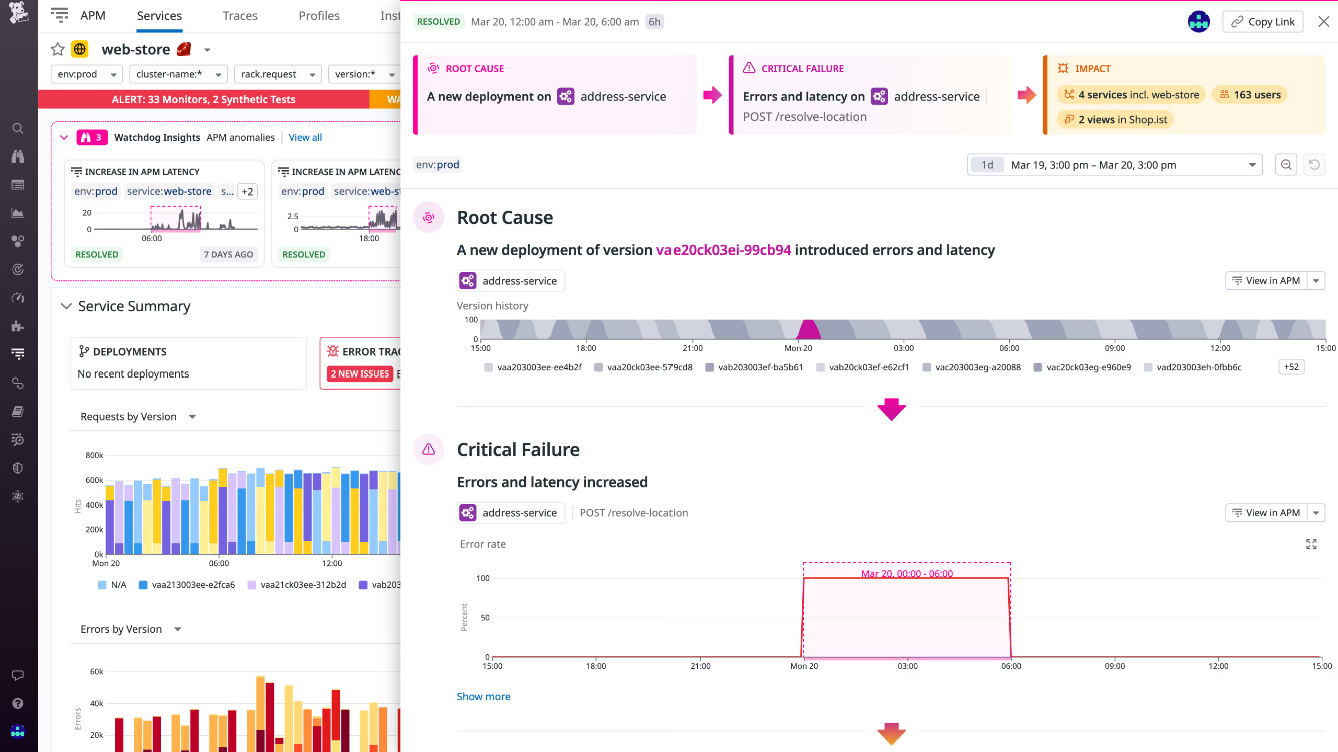
Watchdog AI APM tool addon
The Datadog APM plan advertises a cost of $36/month per host, but in order to utilize the APM tool you are required to also have an Infrustrure plan. These start at $18/month per host. This brings the cost of Datadog (on its face) to $54/month per host at its base level.
Datadogs’ APM tool at a glance.
- 99.8% availability
- 700+ built-in integrations
- Watchdog- built-in intelligence layer that continuously analyzes billions of data points
- “Advertised” starting price of $54/month per host.

Datadog APM tool Pricing
PRTG: High Availability System Monitoring
PRTG Network Monitor APM Tool
PRTG offers multiple solutions for system monitoring and APM tools offering hosted and on-premise solutions. In addition to these solutions, PRTG offers different payment methods to meet your needs standing out as one of the only tools to offer a perpetual license.
The PRTG Monitoring system stands out from many APM tools due to its “failover node” system, which allows 4 simultaneous PRTG core servers to be active on any one machine at a time. This failover system could potentially offer the highest level of availability, and PRTG proclaims its system as “high availability” thanks to this feature.
PRTG boasts its “excellent usability” on all platforms, including web, desktop, and mobile, making it one of the few to actually brag about how well its user interface works.
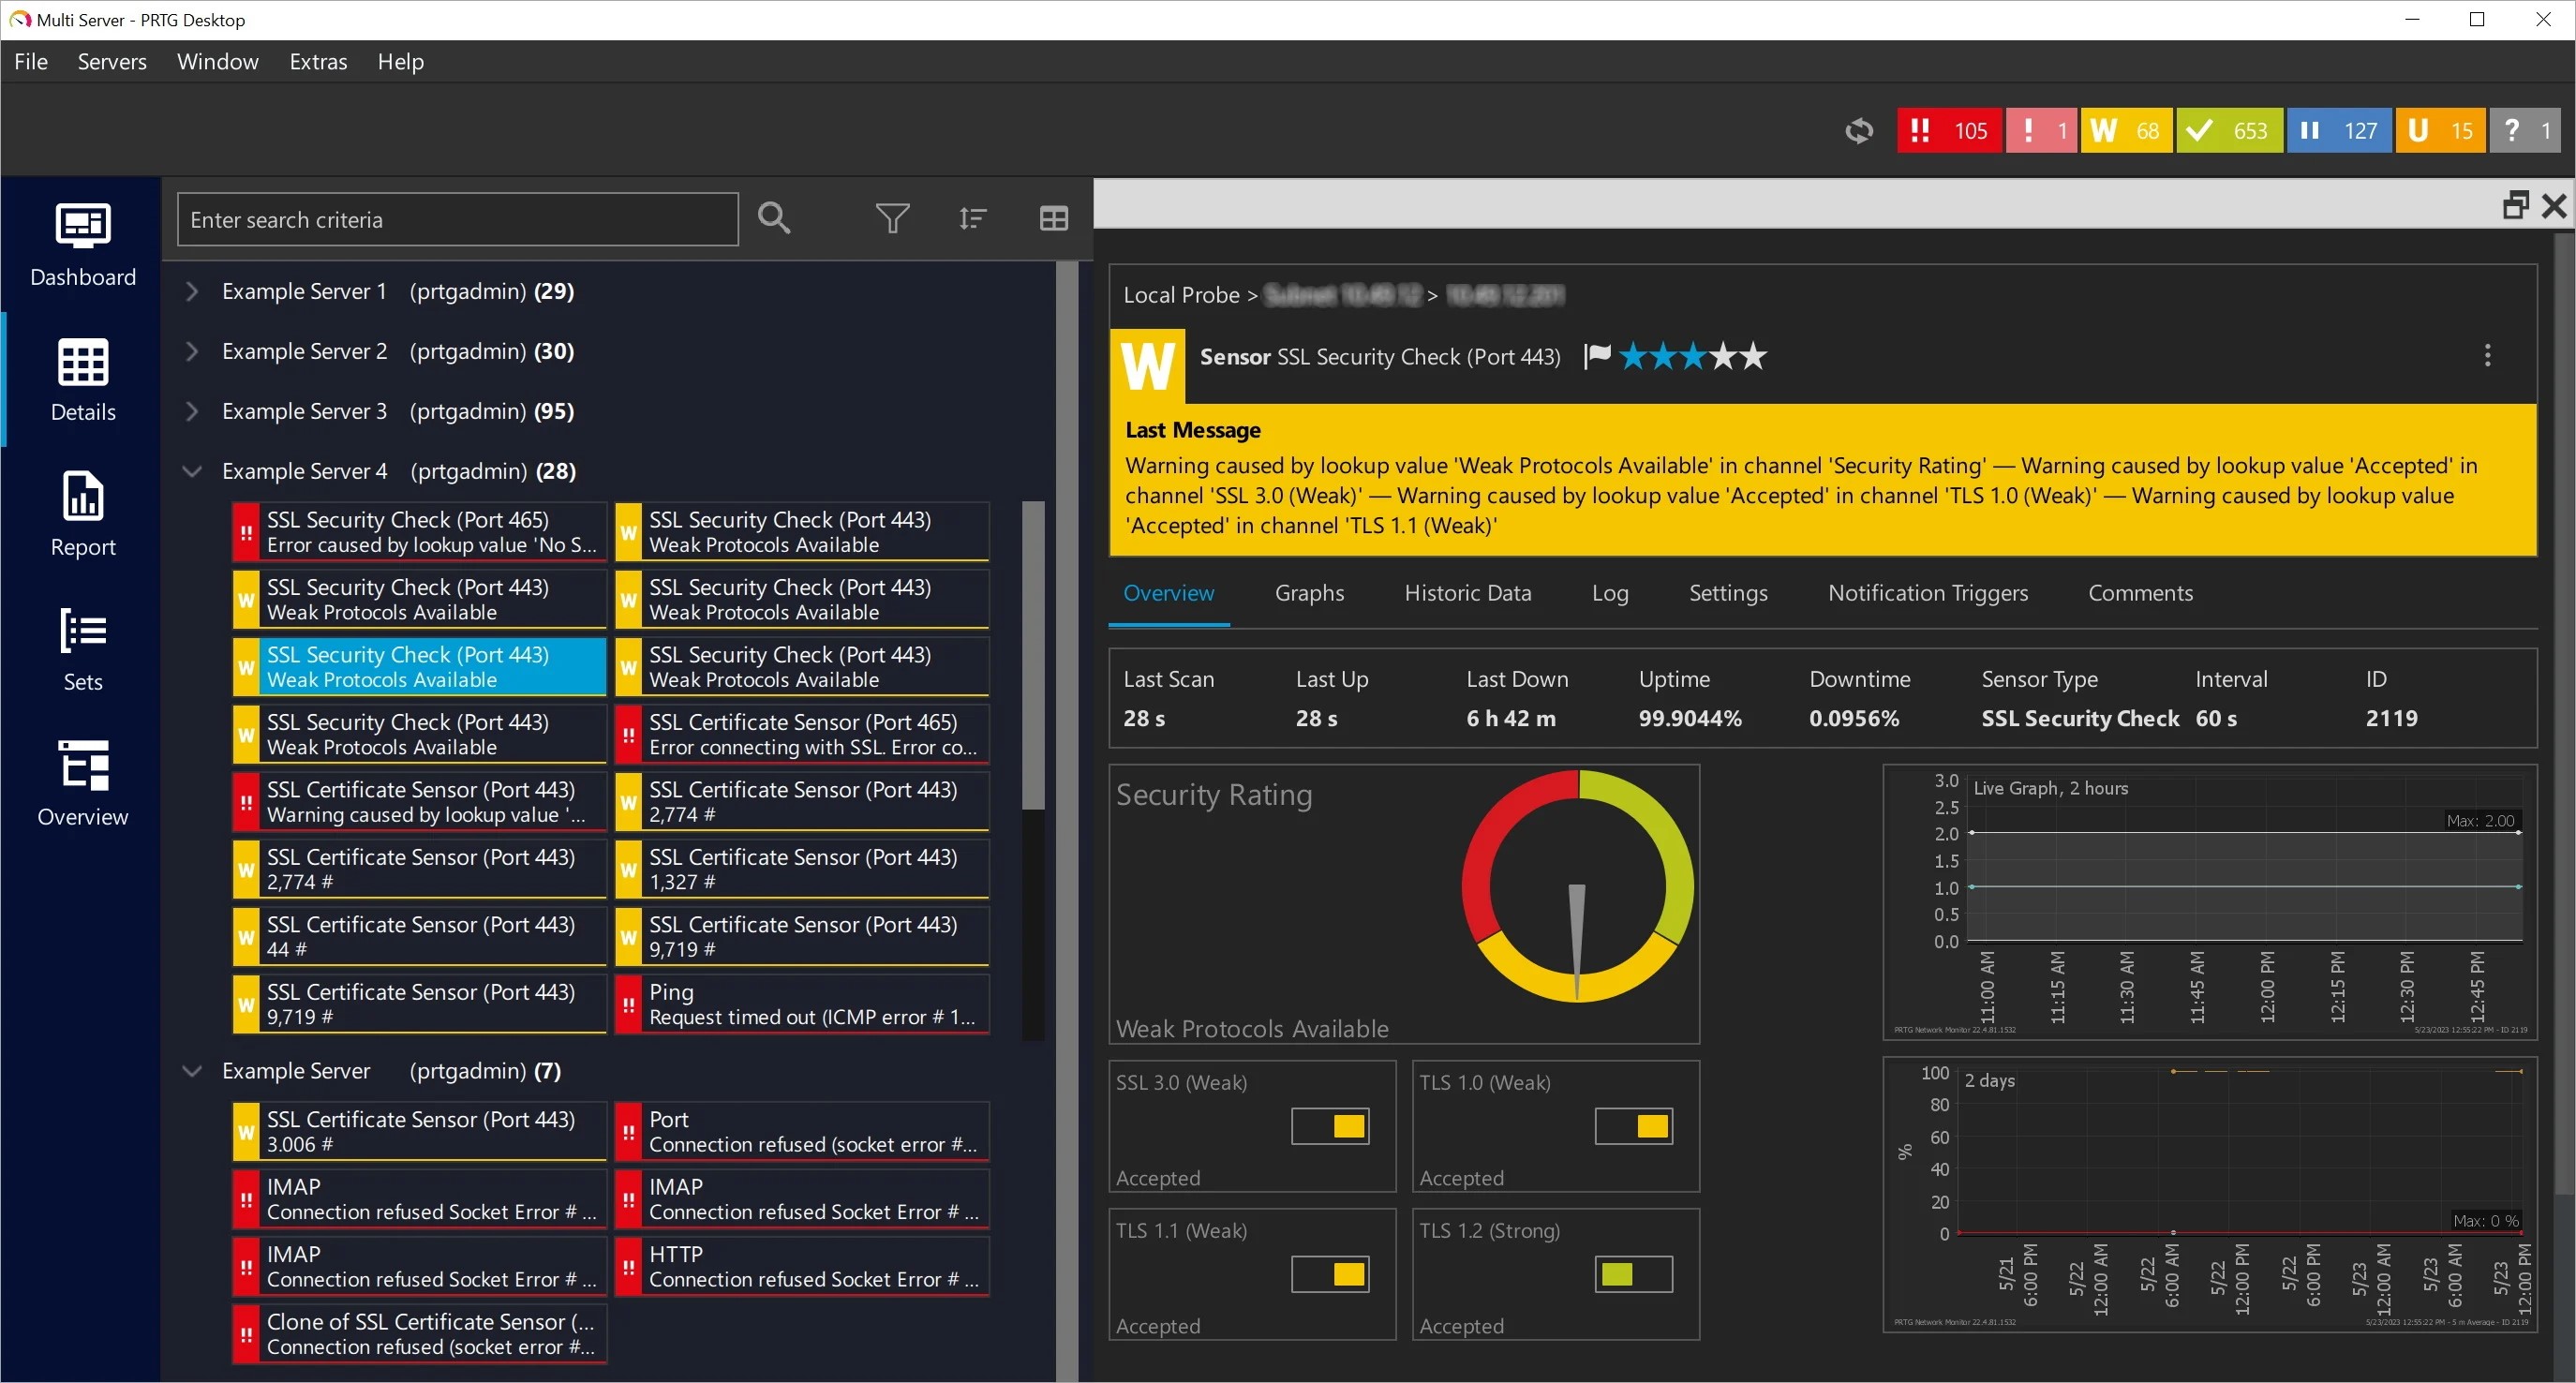
PRTG APM Tool Dashboard
PRTG offers two pricing options: perpetual licensing for its on-premises services and per-month/annual pricing for its hosted services. We will look at one price point for each.
Hosted: Services start at $159/month and covers (according to PRTG) 50 devices.
On-Premises: One-time fee starting at $2,149 per license and covers 50 devices.
Maintenance Plan: To stay up to date with services and tech support PRTG offers maintenance plans that cost ¼ of the original price of your selected plan. This is not required.
PRTGs’ APM tool at a glance:
- On-premises and hosted options
- Failover node system for high availability
- Excellent usability on desktop, mobile, and web.
- Maintenance plans to maintain services
- $159/month for hosted services
- $2,149 one-time perpetual license for a perpetual license
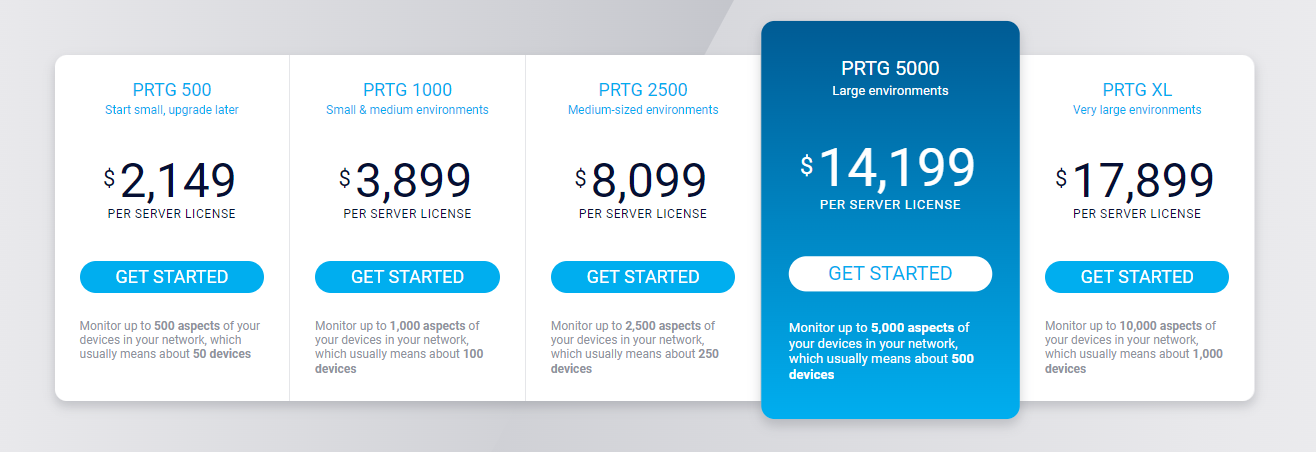
PRTG APM Tool Perpetual License Cost

PRTG APM Tool Hosted Cost
LogicMonitor: Intelligent Observability for Modern Applications
LogicMonitor Logo
When it comes to integrating an APM tool into your system, LogicMonitors' 2000+ integrations and self-proclaimed “lightning-fast implementation” make it the go-to system monitoring tool for any business looking for fast deployment, and smooth integrations. LogicMonitor’s Active Discovery feature actively monitors changes in your environment, automatically discovering and monitoring new virtual machines, volumes, or devices.
LogicMonitor comes with a host of pre-built dashboards offering immediate insight into the data that is most relevant to you and your industry.
With an industry-leading 99.9% availability, LogicMonitor is the choice for those looking for the highest level of promised availability from a hosted service.
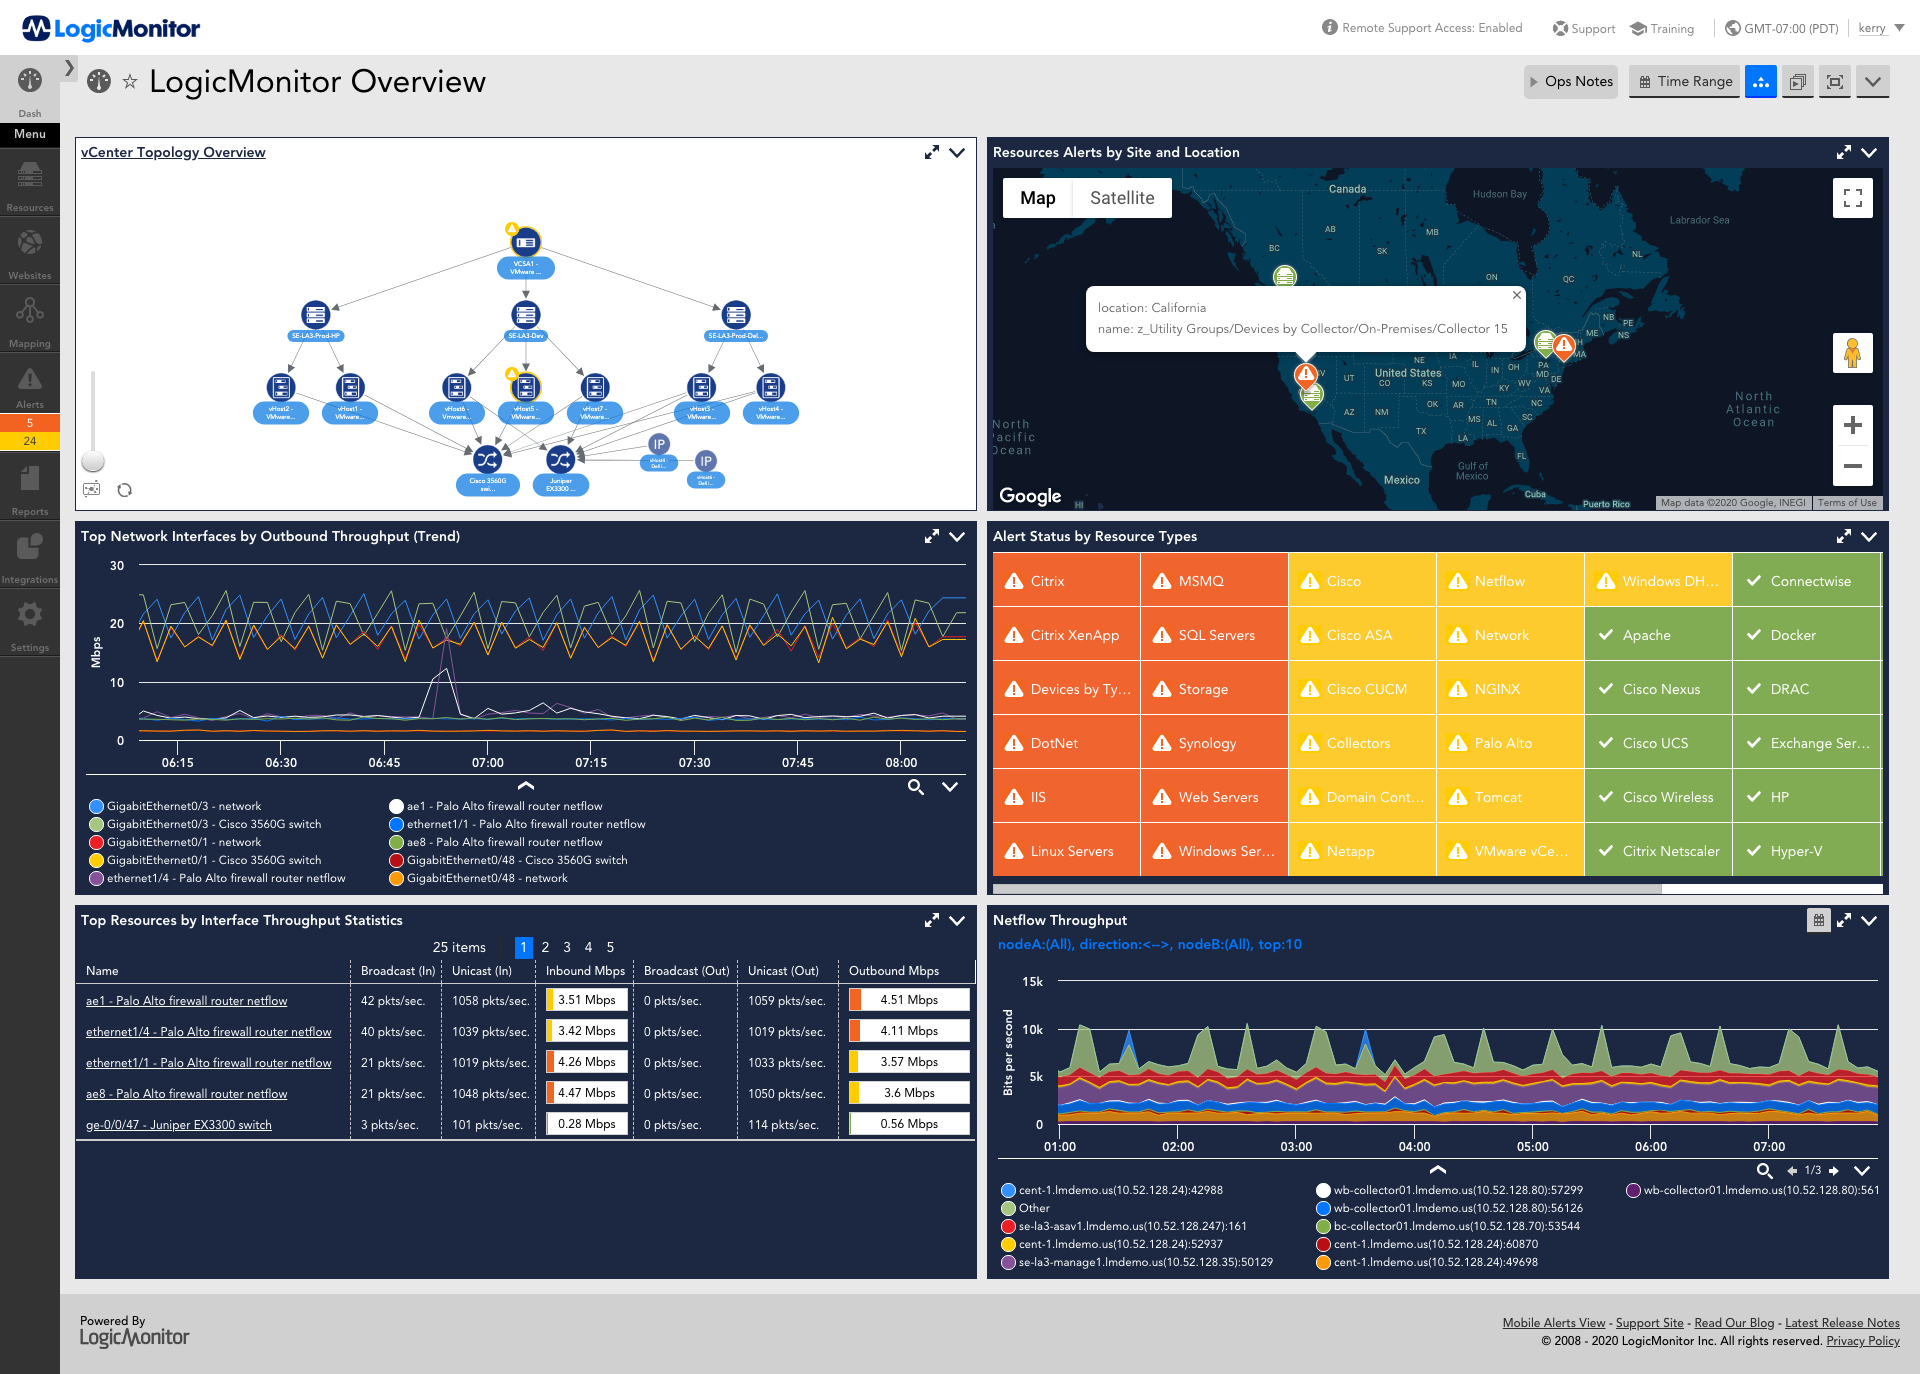
LogicMonitor APM Dashboard
Pricing for LogicMonitors' Infrastructure monitoring plan starts at $22/m per resource (device) with a minimum of 30 resources. Additional add-on plans are available for log retention, AI-powered anomaly detection, and application traces.
LogicMonitors’ APM tool at a glance:
- 2000+ integrations
- Industry-leading 99.9% availability
- Active Discovery feature monitors changes in your environment
- Host of prebuilt dashboards
- Plans start at $22/month per resource(device)
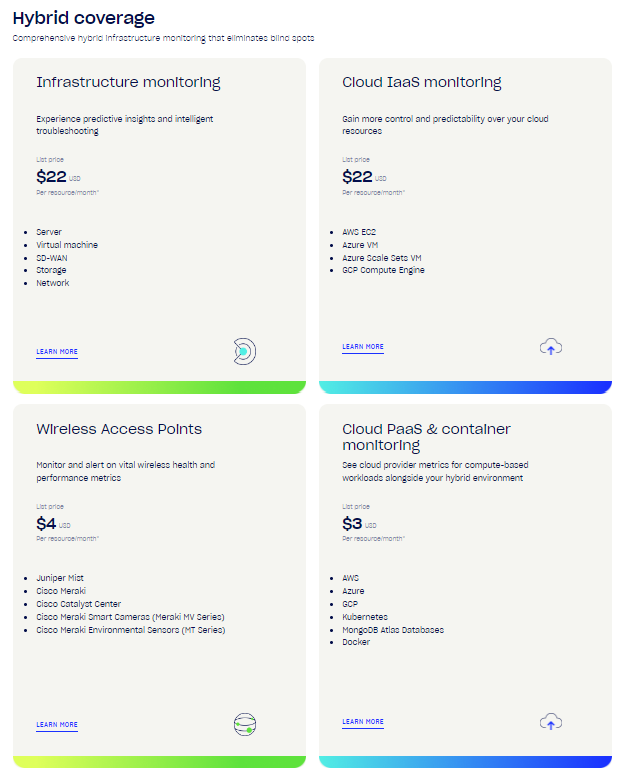
LogicMonitor APM Tool Price
New Relic: Discover True Application Monitoring
New Relic APM Logo
New Relics’ APM tool, APM360, not only monitors your applications with a 99.8% uptime but also gives you access to a slew of New Relic tools, including security monitoring and AIOps.
With over 750 integrations and an industry-leading 8 supported programming languages, APM 360 dramatically increases usability for developers. It features an automatic service map that visualizes dependencies within your systems, simplifying the understanding of complex data structures. APM 360 excels in transforming difficult-to-comprehend data into easily digestible visuals, ensuring that insights are accessible and actionable.
New Relics AI is one of their newest feature allowing users to find and fix issues, get quick insights, translate data and queries, and instrument their system with ease.
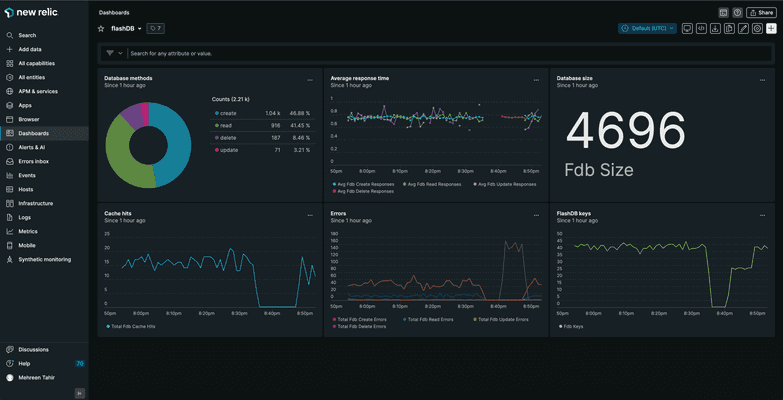
New Relic APM Dashboard
New Relic offers dynamic pricing to meet the needs of every business, large or small. They utilize the following equation to determine pricing on all plans, Data + Users = Price.
New Relics pricing starts at $10/month for the first user with every additional costing $99/m.
New Relics’ APM tool at a glance
- 99.8% uptime
- 750+ integrations
- APM tools give access to all of New Relics tools like AIOps and Security Monitoring
- New Relic AI integrated into the system to assist users
- Pricing starts at $10/month but quickly scales up.
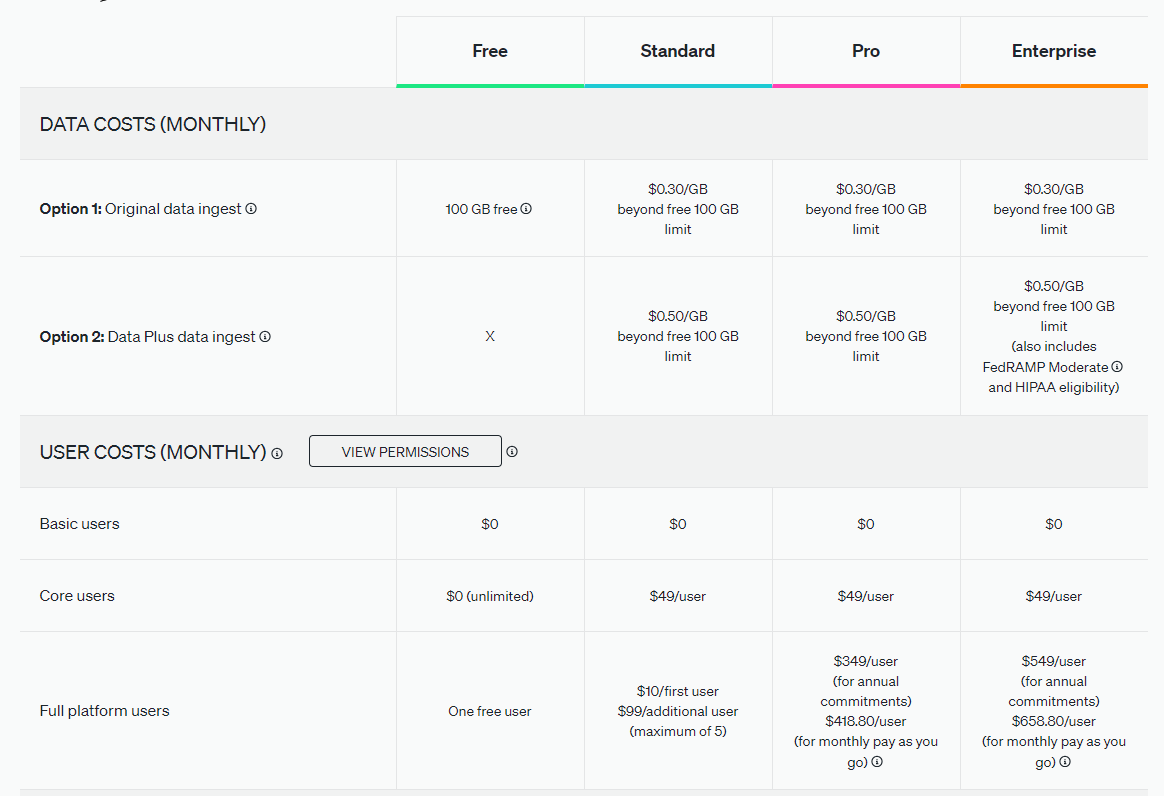
New Relic APM 360 Price
AppDynamics: Make Better Decisions From the Code-Level to the C-suite
AppDynamics Logo
AppDynamics, the self-proclaimed leader in the APM tool sphere, offers a unique business-oriented system monitoring service to its clients connecting data, development teams, and IT teams to business results. Given their mission statement includes “AppDynamics is on a mission to help companies see their technology through the lens of the business” this would make sense. By offering observability across entire organizations, implementing end-to-end observability on a code and transaction level, and presenting data at a level in which C-suite and devs can both understand AppDyanmics upholds that mission.
AppDynamics promises one of the lowest availability rates in the industry: 99.5% uptime. While this number pales in comparison to LogicMonitors' 99.9% uptime, it gives AppDynamics more room to test new features and expand its offering for customers.
As an added bonus to AppDynamics, all paid plans give users “unlimited standard access” to Cisco University.
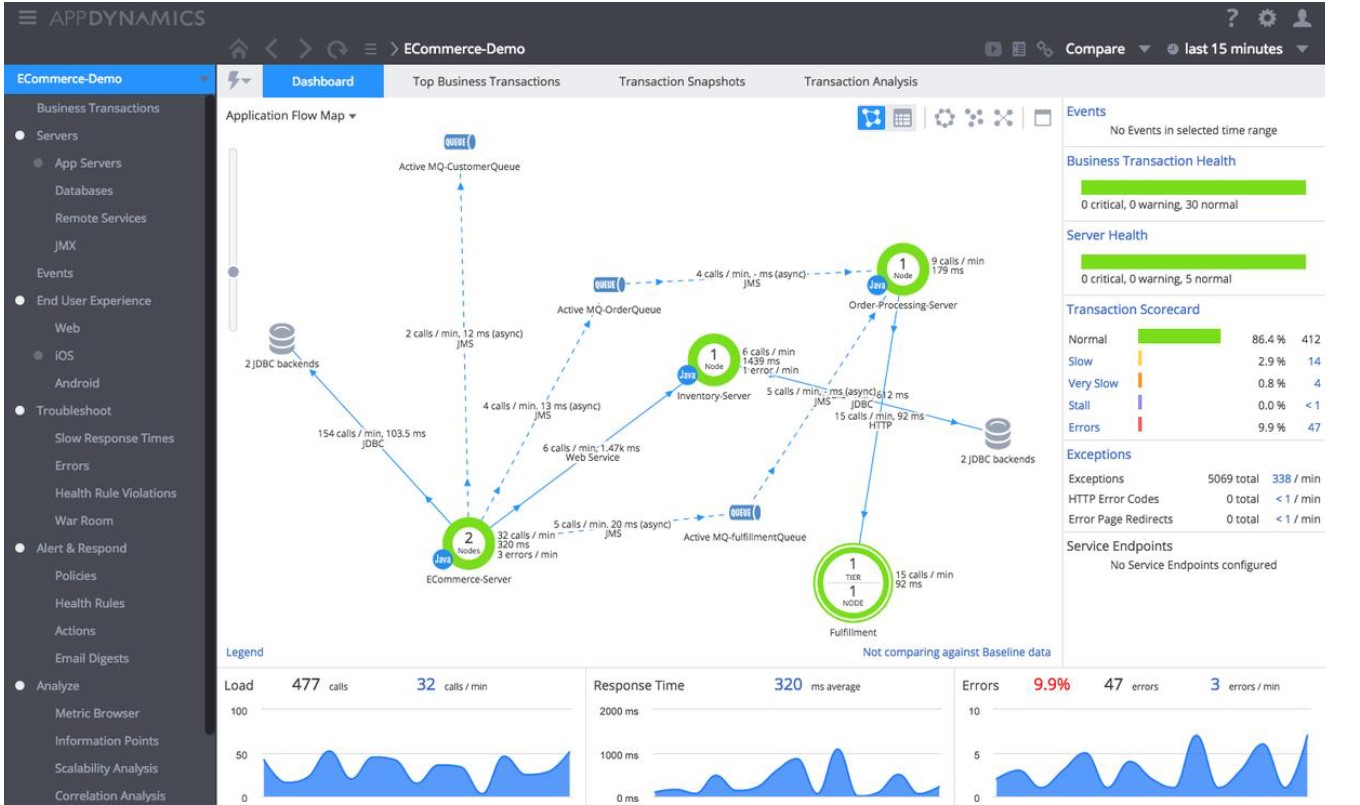
AppDynamics APM Tool Dashboard
Pricing for the AppDynamic APM tool starts at $33/month per core. Users should be aware of additional add-on features when researching their tool.
AppDynamics’ APM tool at a glance:
- 99.5%
- Business-oriented service monitoring
- Access to Cisco University
- Starting price of $33/month
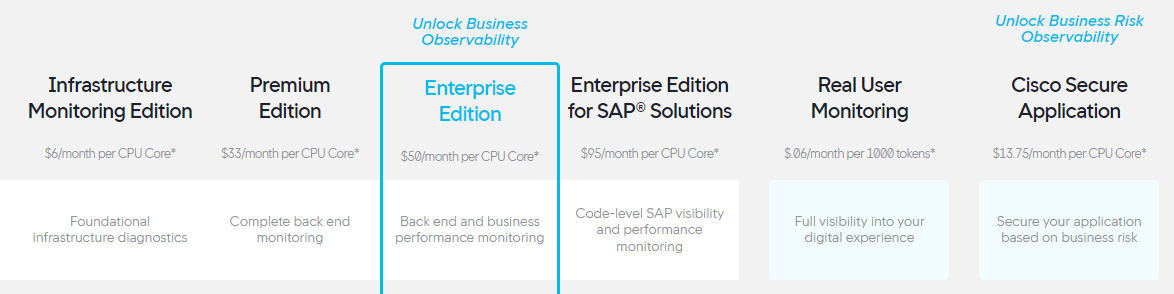
AppDynamic APM Pricing

AppDynamic Addon Pricing
Elastic APM (ELK Stack): Monitor Your Infrastructure, Your Logs, and Your Users All Within a Single Solution

Elastic Logo
Elastic APM offers both self and cloud-managed services to its customers, giving them the flexibility to choose the service they want. Elastic offers a clean and simple view of Application Performance Monitoring, with clean and easy-to-understand dashboards. Their application dependency mapping helps teams identify application problems quickly by automatically visualizing the relationship between services inside your application ecosystem. Partnered with their tail-based Sampling, you will gain a level of observability like none other.
While Elastic does not present a public availability percentage, it does have a historically amazing uptime. Within the last six months, its tool has not fallen below 99.96% uptime, which shows its ability to deliver on uptime.
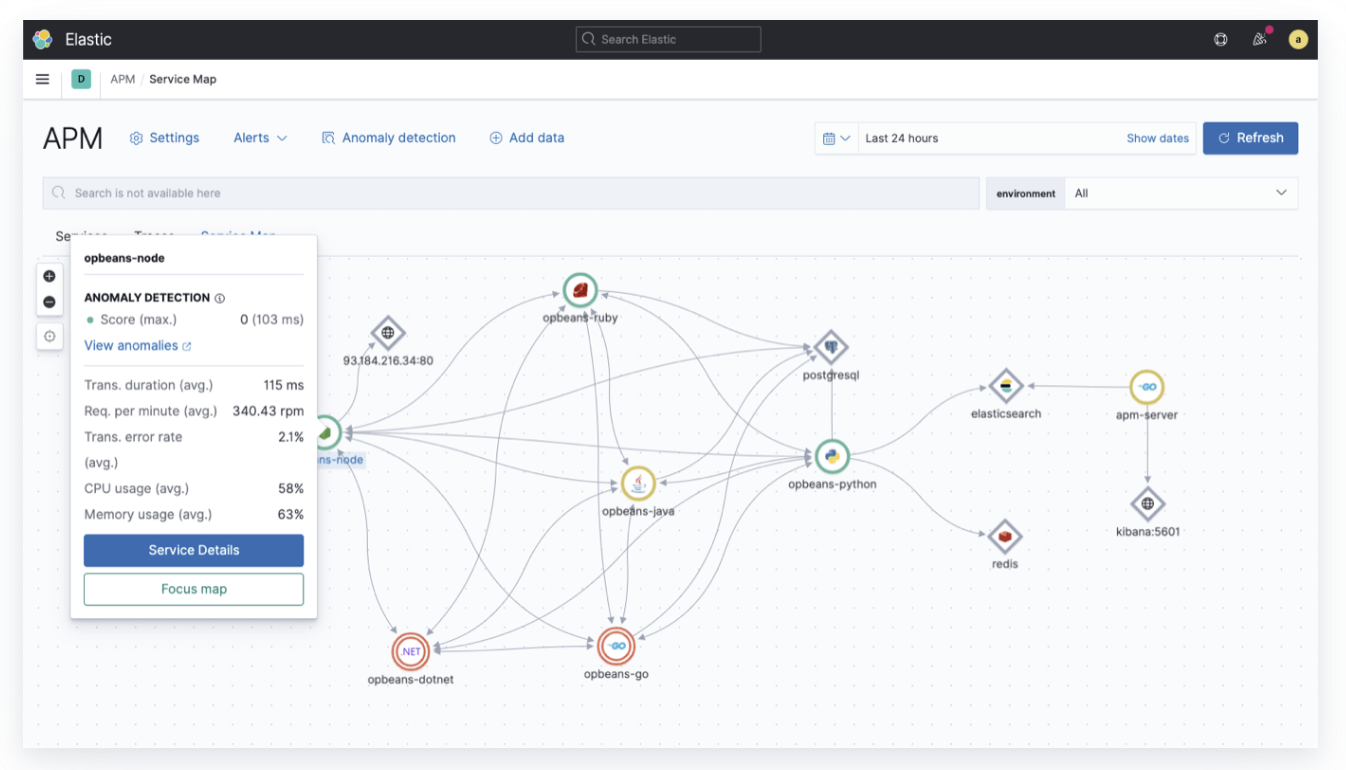
Elastic APM Tool Dashboard
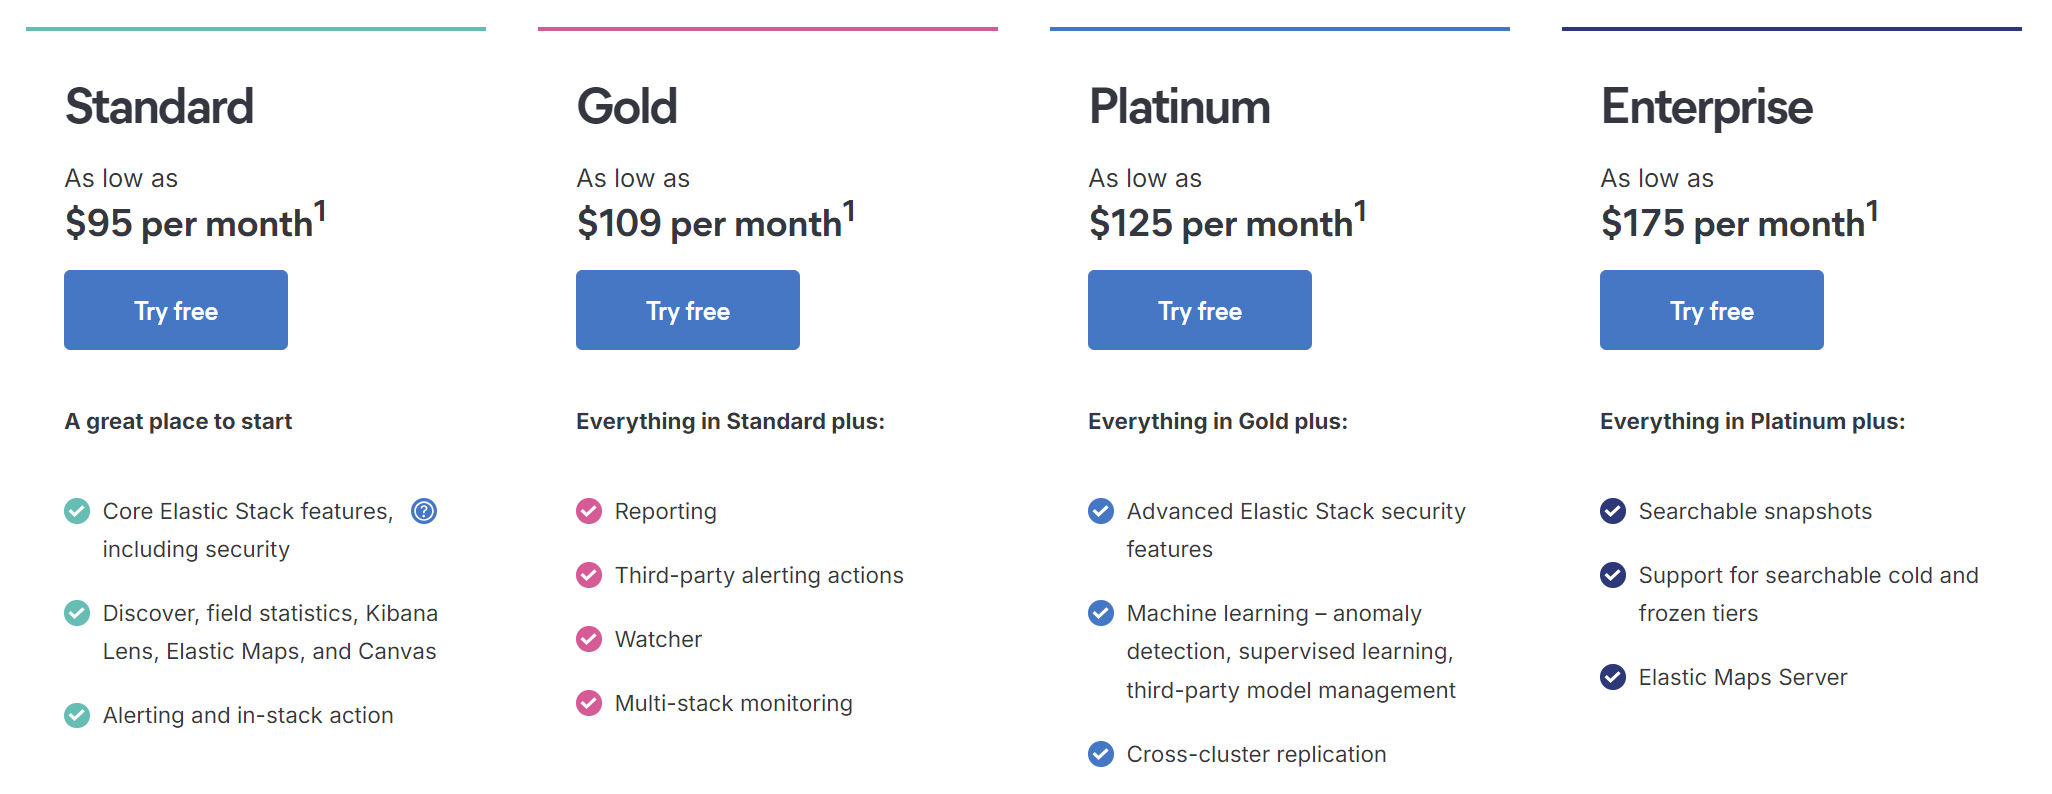
Elastic APM offers a “free” plan for self-hosted monitoring but requires you to contact their sales team for licensing. For cloud-hosted services, Elastics' pricing is advertised as “as low as $95/month.” Pricing is based on your cloud production configuration, but Elastic does offer a price calculator to help you determine your actual cost.
Elastics’ APM at a glance:
- 99.96% historical uptime
- Self-managed and cloud-managed services
- Application dependency mapping
- Starting price “as low as $95/month”
Elastic APM Tool Pricing
SolarWinds: Accelerates the Identification and Root Cause of Application Performance Issues
-cab78c5445ca171732b59dfc1710733b.jpg)
SolarWinds Logo
SolarWinds APM tool, AppOptics, delivers effective and efficient application performance monitoring for the needs of any business, small or large. They boast their cost-effective scaling to match the growth of your businesses.
AppOptics offers full-stack visibility into your application as well as an auto-instrumenting application service, allowing you to quickly diagnose issues within your environment. They present data in a simple, easy-to-understand way that allows you to find issues quickly and dig deeper into them with more detailed views. AppOptics boasts integrations into multiple oncall software, allowing you to be notified of any issues 24/7.
SolarWinds does not offer a publicly available uptime nor do they have a public historic uptime.
SolarWinds APM Tool Dashboard
AppOptics service for Application monitoring includes infrastructure system monitoring and starts at a price of $24.99/month per host. They sell hosts in packs of 10, meaning the minimum monthly cost for AppOpicts is $249.90/month.
AppOptics APM tool at a glance:
- Simple and efficient data presentation
- 150+ integration
- Built-in oncall alerting integrations
- Non-public SLA and historic uptime
- $24.99/month per host
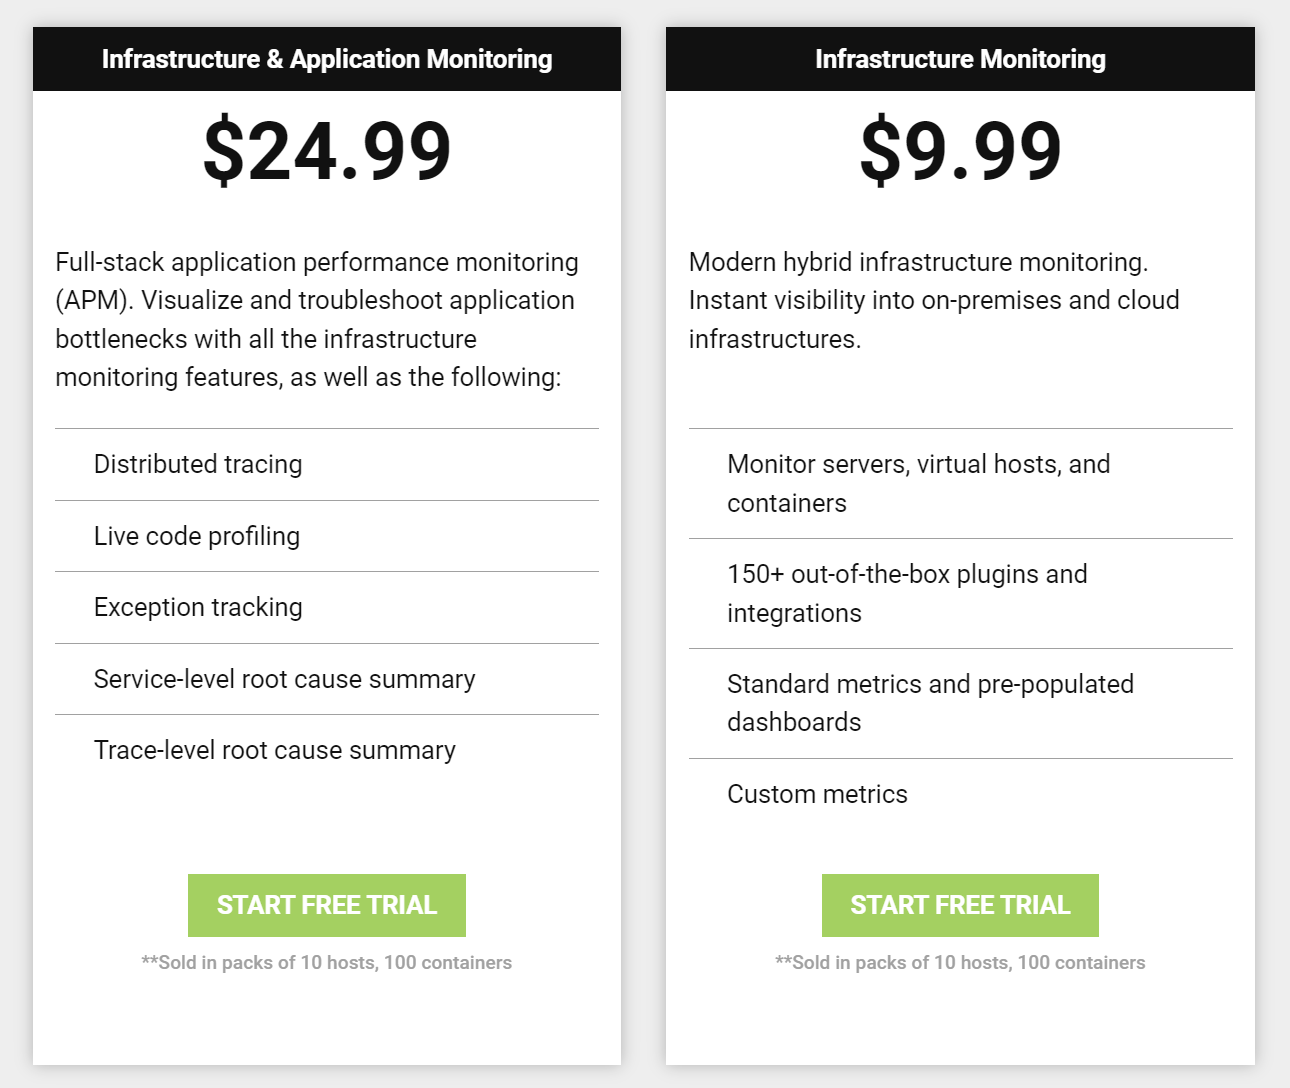
SolarWinds APM Tool Pricing
Finding The APM Tool For You
System monitoring or APM tools are essential for maintaining uptimes, detecting service failures, and evaluating performance. Whether you’re looking for a service with high uptimes, every integration under the sun, or unmatched services, there is a tool that fits your needs. When selecting an APM tool, factors like reliability, scalability, integration, cost, and usability must be considered to meet the current and future needs of your business. System monitors are only one tool in your arsenal to maintain service levels and improve overall performance. Most organizations partner these tools with oncall management tools like PagerTree to ensure their teams are being notified when incidents occur.