How to calculate MTTR and Other Common Incident Recovery Metrics
Whether it’s scheduled maintenance or an unexpected outage, downtime affects every aspect of your business and comes with significant costs. Understanding recovery metrics, how they are calculated, and what you can do to improve them will help you maintain SLAs, improve uptimes, and provide better services.
So, what are these commonly used incident management metrics?
- Downtime
- Uptime
- Mean Time to Recovery (MTTR)
- Mean Time to Resolve (MTTR)
- Mean Time to Repair (MTTR)
- Mean Time to Acknowledgement (MTTA)
- Mean Time Between Failures (MTBF)
- Error Budget
What is MTTR? (Video)
What are Uptime and Downtime?
Uptime and downtime are two metrics used consistently to help determine the availability, reliability, and overall performance of services. These two metrics are closely linked and directly affect each other and your business.
Downtime
Downtime - is the time your service is unavailable for use.
Whether it's a planned maintenance or an unexpected outage, downtime is when your services are unavailable. Downtime is ultimately costly to fix and breaks customer trust. Simply put, downtime is expensive.
Uptime
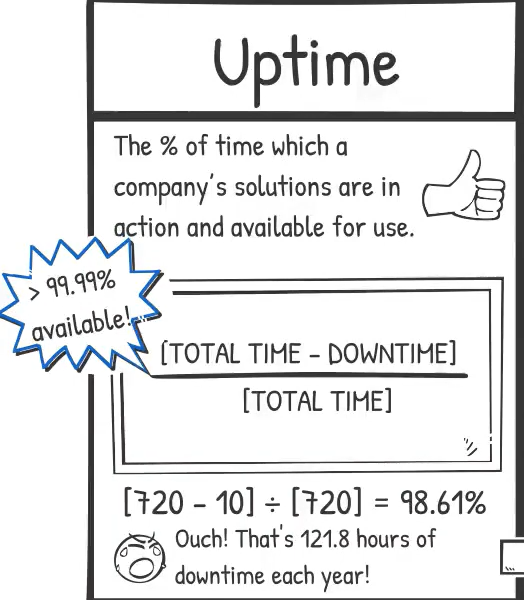
Uptime - is the % of time in which a company’s services are available for use.
Uptime is calculated as [Total Time - Downtime] / [Total Time] within a given period.
Uptime is an important measure of operational availability.
Uptime answers, “Can our customers trust us to be there when we say we will?”
How to calculate uptime
Before answering the question, “What is MTTR?” we must first understand the importance of uptime and why it matters. In today’s connected world, consumers tend to expect 24/7/365 availability. Best-in-class technology companies typically target 99.99% uptime. Put differently that means being available for their customers for all but 52.6 minutes over the course of a year. Depending on your industry and service level agreements (SLAs), you may need to target an even higher uptime percentage.
What is MTTR?
MTTR can have different meanings depending on its context. The R can stand for repair, recovery, or resolve. When communicating with others, it's important everyone understand which MTTR is being discussed.
Mean Time To Recovery (MTTR)
Mean Time To Recovery (MTTR) - is the average time it takes to recover from a system failure. This includes the time the system begins to fail to the time that it becomes fully operational again.
Mean Time To Recovery (MTTR) is calculated as [Total Downtime] / [# of Incidents] within a given period.
Mean Time To Recovery answers, "How quickly can we restore service to our customers?"
Mean Time To Recovery expresses the average downtime and is a good metric for assessing the speed of your systems' overall recovery process.
Mean Time To Resolve (MTTR)
Mean Time To Resolve - the average time it takes to fully resolve an incident. This includes the time spent detecting, diagnosing, repairing, and learning so that the failure won't happen again.
Mean Time To Resolve (MTTR) is calculated as [Full Resolution Time] / [# of Incidents] within a given period.
MTTR is an important metric because it measures operational resilience.
Mean Time To Resolve answers, “How long does it take the company to recover from an incident and implement systems and processes so the incident doesn't happen again?”
-f38cbb55172ae8b26f936434ab0346bf.jpg)
MTTR Calculation
Mean Time To Repair (MTTR)
Mean Time To Repair (MTTR) is the average time it takes to repair a system, including the repair time and any testing time.
Mean Time To Repair (MTTR) is calculated as the [Total Time Spent Repairing] / [# of Repairs]
Mean Time To Repair is a metric that support and maintenance teams use to keep repair times on track. The goal is to keep this number as low as possible by improving the efficiency of repair processes.
Mean Time To Repair answers, "How long does it take the company to troubleshoot and repair the system?"
Mean Time To Acknowledge (MTTA)
Mean Time To Acknowledge - the average time it takes from when an incident is identified to when an alert is acknowledged.
Mean Time to Acknowledge (MTTA) is calculated as the [Total Time to Acknowledge] / [# of Incidents] within a given period.
Mean time to acknowledge (MTTA) measures the first step in the recovery process: acknowledgment. Once someone acknowledges the incident alert, the rest of the recovery process can begin. Acknowledgment not only signifies a significant milestone within MTTR but also assigns ownership to whoever acknowledged the incident. Ownership can be passed from one individual to the next, but incident response best practices suggest keeping a clear owner/lead to drive the recovery process at all times.
MTTA is an important metric because it’s a measure of operational responsiveness.
Mean Time To Acknowledge answers, “How long does it take the company to begin working toward a resolution?”
-045ddcbb51d483509d3f115bcde1812c.jpg)
MTTA Calculation
Mean Time Between Failures (MTBF)
Mean Time Between Failures - the average time between repairable service failures.
MTBF is calculated as [Total Time - Downtime] / [# of Incidents] within a given period.
It’s one thing to resolve issues quickly. It’s another to prevent them from happening in the first place. MTBF acts as a counterbalance to MTTR. It ensures your teams are getting smarter, not just faster, about incident resolution.
MTBF is an important metric because it measures operational reliability.
Mean Time Between Failures answers the question, “How often do our systems break?”
-06a27e95aa13489060b059c6121b9326.jpg)
MTBF Calculation
Putting It Together - An Example
Let’s say you measure your numbers over a 30-day (720 hours) period, and you get the following;
- 5 outages
- 10 hours of downtime
- 180 minutes total time to acknowledge
What’s your Uptime, MTTR, MTTA, and MTBF?
- Uptime = [Total Time - Downtime] / [Total Time] = [720 - 10] / [720] = 98.61%
- MTTR (recovery) = [Downtime] / [# of incidents] = 10/5 = 2 hours
- MTTA = [Total Time to Acknowledge] / [# of incidents] = 180/5 = 36 minutes
- MTBF = [Total Time - Downtime] / [# of incidents] = [720 - 10] / [5] = 142 hours
How might we interpret these results?
The 98.61% uptime is lower than our targeted best-in-class uptime of 99.99%, so we have room for improvement. We’ll need to dive into the other metrics to figure out where we’re falling short. A 2-hour MTTR (recovery) isn’t horrible, but it’s not great, either. We need to take a look at the distribution here. Are we consistently taking 2 hours, or was there one extreme outlier?
A 36-minute MTTA is unacceptably long. We should reduce it to single digits if not sub 5 minutes. That would reduce total downtime by over 2 hours each month.
MTBF is currently just under 6 days, which feels too frequent. We should investigate the incident data and see if we can identify any trends or recurring outage patterns.
The metrics here give us a quick pulse on our incident recovery process, where we need to improve, and where we need to do some further investigation. As you build out your process, metrics, and review cycles, don’t forget to segment your incidents by severity for greater clarity.
Error Budget
Every DevOps and IT Operations team knows that incidents will happen. There's no such thing as 100% guaranteed uptime because it's statistically impossible. The industry standard says that 99.9% uptime is very good, and 99.99% is excellent.
Even if your team is good at avoiding downtime or resolving incidents, it could mean you are not taking enough risks. So, instead of setting user expectations too high (or too low), industry experts recommend setting an error budget.
Error Budget - The maximum time a system can fail without contractual consequences.
So, for example, if your service promises 99.9% uptime, your team has 8 hours and 45 minutes of acceptable downtime per year. How you spend your downtime is up to you, but preferably, it should be used to innovate and take risks.
The benefit of an error budget approach is that it encourages teams to minimize real incidents and maximize innovation.
| Uptime | Yearly Allowed Downtime | Monthly Allowed Downtime |
|---|---|---|
| 99% | 87h, 39m | 7h, 18m |
| 99.5% | 43h 49m, 45s | 3h, 39m |
| 99.9% | 8h, 45m, 57s | 43m, 50s |
| 99.95% | 4h, 22m, 48s | 21m, 54s |
| 99.99% | 52m, 35s | 4m, 23s |
| 99.999% | 5m, 15s | 26s |
What's next?
In this article, we answered the question, “What is MTTR?” We also reviewed the other key metrics of incident response management, including downtime, uptime, MTTA, MTBF, and error budgeting. Now that you understand these metrics, you may be wondering how you can start monitoring your systems and respond to outages quickly. PagerTree has put together a list of the Top 7 Best APM Tools to help you get started with system monitoring. We have also compiled a list of the Top 5 oncall management software to help your team get notified 24/7.
\