Data Model
Time Series
Prometheus stores all data as time series: streams of numeric values sampled at ongoing timestamps.
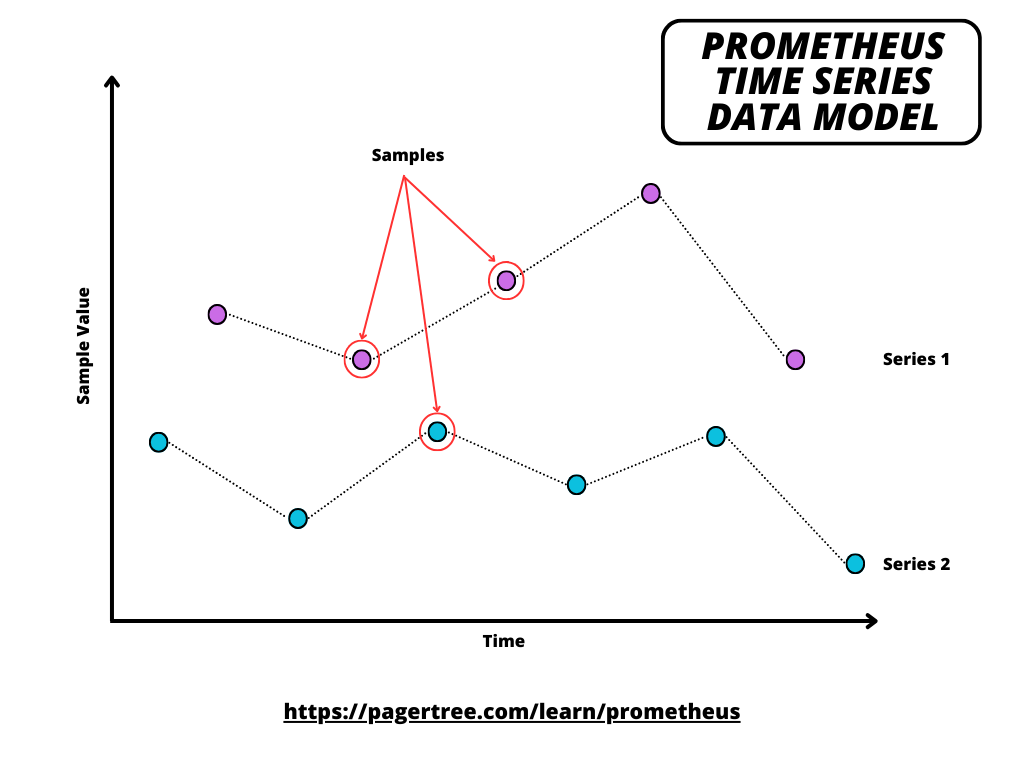
Prometheus Time Series Data Model
Every time series is uniquely identified by its metric name and optional labels.
| Series                                           | Value |
| ------------------------------------------------ | ----- |
| http_requests_total{method="POST", status="200"} | 4130  |
| http_requests_total{method="POST", status="500"} | 2     |
What is a Metric?
In Prometheus, everything revolves around metrics. A metric is a feature (i.e., a characteristic) of a system being measured. Typical examples of metrics are:
- http_requests_total
- http_request_size_bytes
- system_memory_used_bytes
- node_network_receive_bytes_total
What is a Label?
In Prometheus, metric labels are sets of key-value pairs that help categorize and differentiate subdimensions.
Typical examples of labels for the http_requests_total metric include:
- method:
GET|PUT|POST|DELETE - status:
100..599 - path:
/api/v4/alerts
CAUTION: Remember that every unique combination of key-value label pairs represents a new time series, which can dramatically increase the amount of data stored. Do not use labels to store dimensions with high cardinality (many different label values), such as user IDs, IP addresses, email addresses, or other unbounded values.
Samples
Samples form the bulk data and are appended to a series over time.
- Timestamps - 64-bit integers in millisecond precision.
- Sample values - 64-bit floating point numbers.
Naming Conventions
Metric names should follow these rules:
- Use a single-word application prefix ("namespace") for the application's domain (e.g., pagertree_notifications_total, process_cpu_seconds_total, http_request_duration_seconds).
- Use a single unit specified in base units.
- Use a suffix describing the unit (e.g., pagertree_notifications_total, node_memory_usage_bytes, process_cpu_seconds_total).
- Represent a logical thing being measured (e.g., number of notifications sent, bytes of data transfer, request duration).
Base Units
Prometheus does not have any hard-coded units. Base units should be used for better compatibility. The following lists some metrics families with their base units. The list is not exhaustive.
| Category | Base Unit |
|---|---|
| Time | seconds |
| Temperature | celcius |
| Length | meters |
| Bytes | bytes |
| Bits | bytes |
| Percent | ratio |
| Voltage | volts |
| Electric current | amperes |
| Energy | joules |
| Mass | grams |