Metric Types

Prometheus Metric Types
Counter
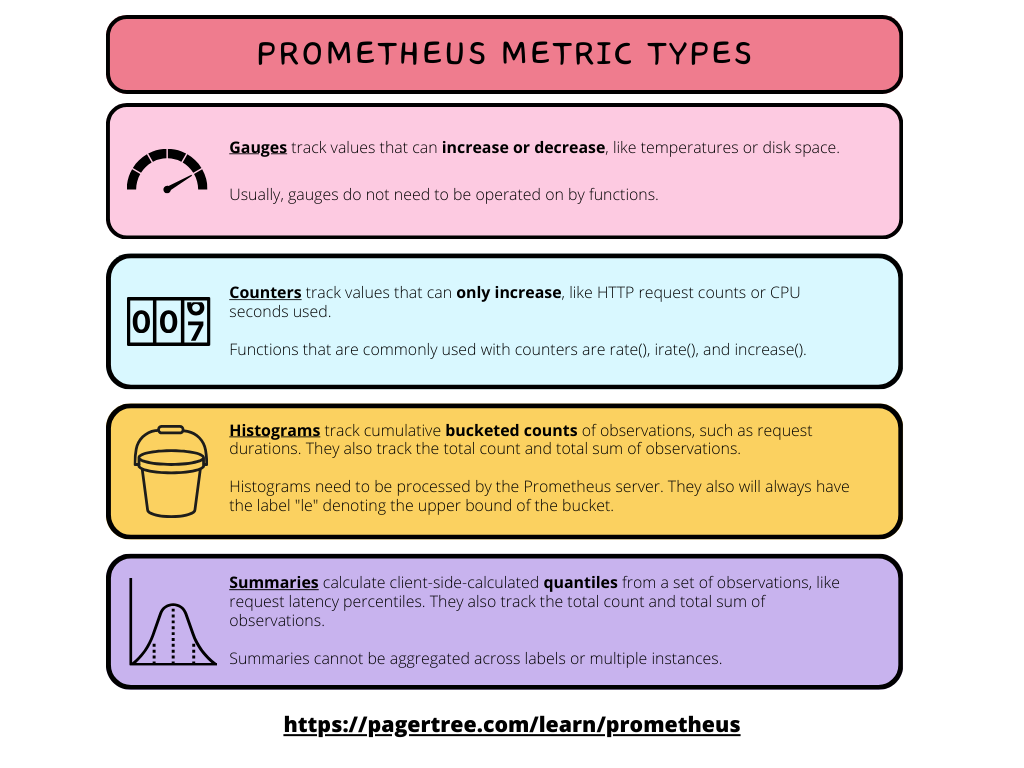
Counters track values that can only increase, like HTTP request counts or CPU seconds used.
Functions that are commonly used with counters are:
# HELP http_requests_total The total number of HTTP requests.
# TYPE http_requests_total counter
http_requests_total{method="POST",code="200"} 1027
http_requests_total{method="POST",code="400"}    3
Gauge
Gauges track values that can increase or decrease, like temperatures or disk space.
Usually, gauges do not need to be operated on by functions before they can be graphed.
# HELP process_open_fds Number of open file descriptors.
# TYPE process_open_fds gauge
process_open_fds 15
Summary
Summaries calculate client-side-calculated quantiles from observations, like request latency percentiles. They also track the total count and total sum of observations.
NOTE: Summaries cannot be aggregated across labels or multiple instances.
NOTICE: The client has already reduced summaries into a floating point number.
# HELP rpc_duration_seconds A summary of RPC durations in seconds.
# TYPE rpc_duration_seconds summary
rpc_duration_seconds{quantile="0.01"} 3.102
rpc_duration_seconds{quantile="0.05"} 3.272
rpc_duration_seconds{quantile="0.5"} 4.773
rpc_duration_seconds{quantile="0.9"} 9.001
rpc_duration_seconds{quantile="0.99"} 76.656
rpc_duration_seconds_sum 5.7560473e+04
rpc_duration_seconds_count 2693
Histogram
Histograms track cumulative bucketed counts of observations, such as request durations. They also track the total count and total sum of observations.
Histograms need to be processed by the Prometheus server. They also will always have the label "le" denoting the upper bound of the bucket.
NOTICE: Histograms are observed as counts, similar to the counter metric type.
# HELP http_request_duration_seconds A histogram of the request duration.
# TYPE http_request_duration_seconds histogram
http_request_duration_seconds_bucket{le="0.05"} 24054
http_request_duration_seconds_bucket{le="0.1"} 33444
http_request_duration_seconds_bucket{le="0.2"} 100392
http_request_duration_seconds_bucket{le="0.5"} 129389
http_request_duration_seconds_bucket{le="1"} 133988
http_request_duration_seconds_bucket{le="+Inf"} 144320
http_request_duration_seconds_sum 53423
http_request_duration_seconds_count 144320
Summary vs Histogram
Both histogram and summary metrics can be used to calculate quantiles, but they have different trade-offs. The most important is that summary metrics cannot be aggregated over dimensions or multiple instances. The official documentation provides an in-depth analysis of the differences.