Pushgateway
What is Pushgateway?
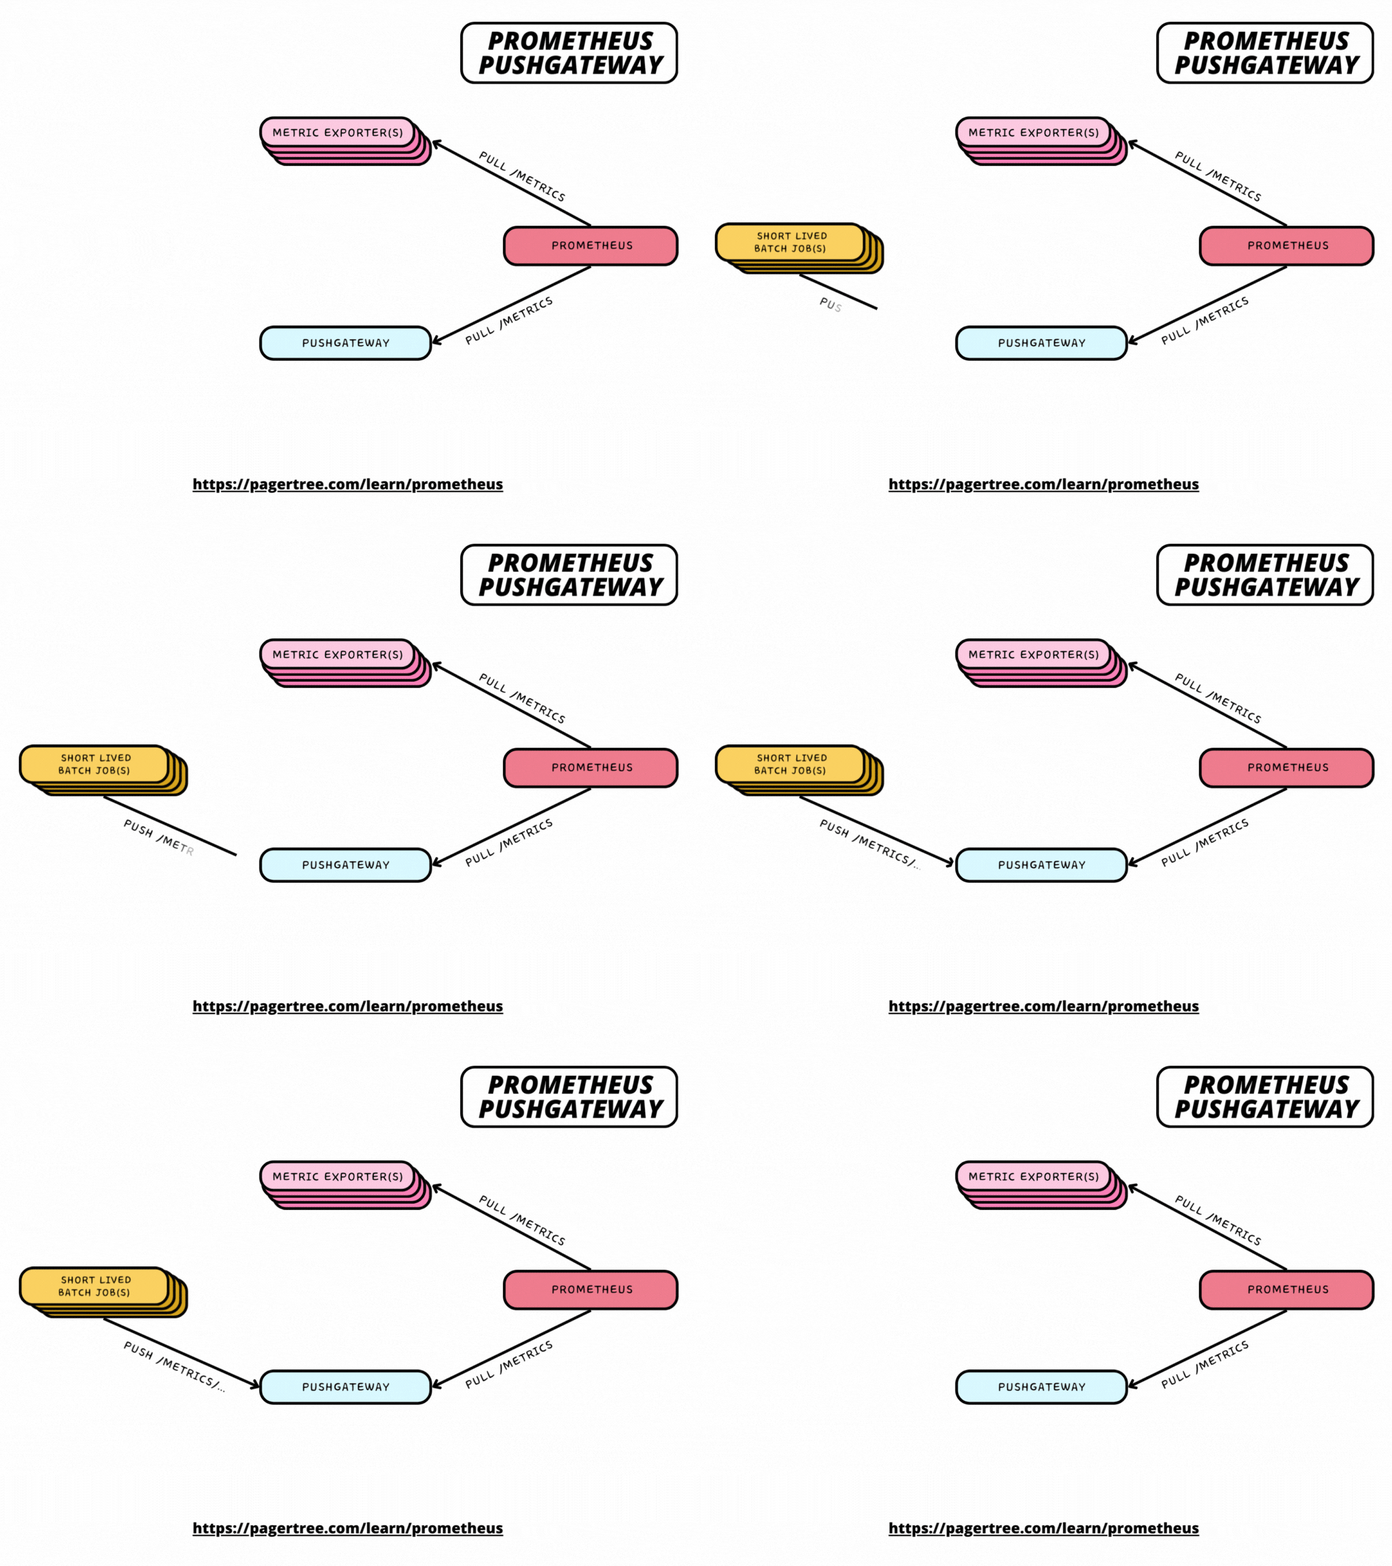
Pushgateway is a component in the Prometheus ecosystem that allows short-lived jobs to expose their metrics to Prometheus. It is an intermediary between short-lived job instances (which may not be consistently available for scraping) and Prometheus. Here's how Pushgateway works and what it does:
- Job Persistence: Pushgateway allows short-lived jobs to push their metrics to it, rather than Prometheus scraping them directly. These jobs may be transient, such as cron jobs or batch jobs that run periodically and do not live long enough to be scraped.
- Push Mechanism: Instead of the traditional pull mechanism used by Prometheus, where Prometheus scrapes metrics endpoints on targets, Pushgateway flips the model. Jobs push their metrics to the Pushgateway using a simple HTTP POST request.
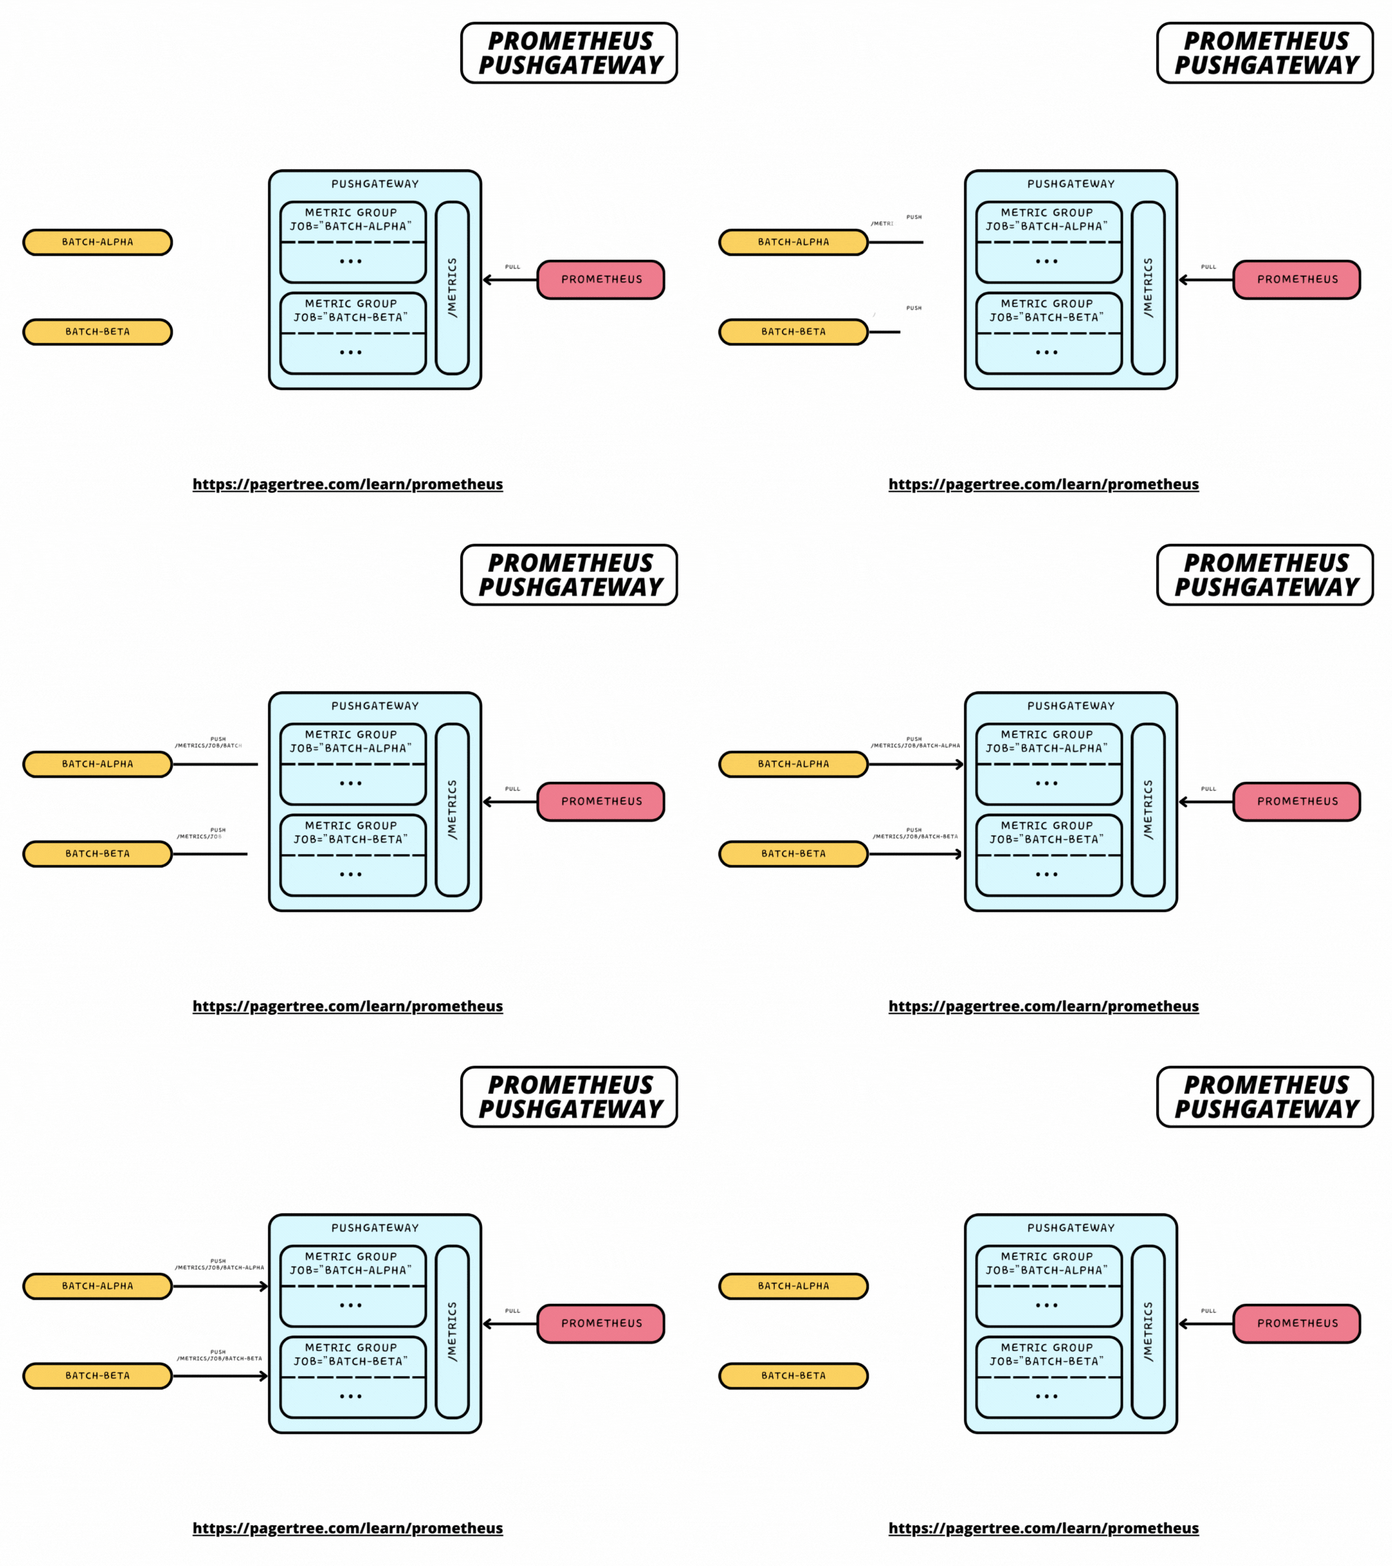
- Grouping and Labeling: Pushgateway allows jobs to attach labels to the metrics they push. These labels can help group and identify metrics from different instances of the same job or different jobs altogether.
- Prometheus Compatibility: Pushgateway is designed to work seamlessly with Prometheus. Prometheus can be configured to scrape metrics from the Pushgateway, just like it would with any other Prometheus target.
In essence, Pushgateway enables Prometheus to collect metrics from jobs or instances that are not long-lived or constantly available. It provides a way for these ephemeral metrics to be stored and queried alongside metrics from other sources in Prometheus.

How Pushgateway fits in the Prometheus Architecture
When should I use Pushgateway?
Pushgateway should only be used to capture the outcome of a service-level batch job. A "service-level" (or "application-level") batch job is not related to a specific machine or job instance. An example of a service-level batch job could be the number of images an application resizes.
When should I not use Pushgateway?
Do not try to use Pushgateway to turn Prometheus into a push-based system or do machine-level monitoring. There are several reasons for this:
- Pushgateway becomes a single point of failure for all pushed metrics and a potential bottleneck.
- You lose the benefits of Prometheus' service discovery support and automatic health monitoring (
upmetric). - Pushgateway does not expire metrics automatically, which could lead to Prometheus scaping stale metrics unless they are manually deleted.
Prometheus Configuration
Pushgateway exposes metrics about itself as well as the groups of metrics that other jobs have pushed to it under the /metrics HTTP path. Thus, you can scrape it like any other target.
Add the following to the scrape_configs section in your prometheus.yml to scrape the Pushgateway:
- job_name: 'pushgateway'
  honor_labels: true
  static_configs:
    - targets: ['pushgateway.example.org:9091']
Note the honor_labels: true scrape option. Because the Pushgateway proxies metrics from other jobs that usually attach their own job label to a group of metrics, you will want to prevent Prometheus from overwriting any such labels with the target labels from the scrape configuration.
Pushgateway API

Pushing Metrics From Batch Jobs to Pushgateway
Pushing Metrics
Pushing metrics is as simple as making a POST request to your Pushgateway instance using the following URL format:
/metrics/job/<JOB_NAME>{/<LABEL_NAME>/<LABEL_VALUE>}
where <JOB_NAME> is used as the value of the job label, followed by any number of other label pairs.
Push A Single Metric
The following example makes a POST request with the following metric labels {__name__="some_metric",job="some_job"}.
  echo "some_metric 3.14" | \
    curl --data-binary @- \
    http://pushgateway.example.org:9091/metrics/job/some_job
Deleting Metrics
You can delete metric groups via Pushgateway's web interface or HTTP API.
Delete A Single Metric
curl -X DELETE http://pushgateway.example.org:9091/metrics/job/some_job
Persistent Storage
By default, Pushgateway only stores metrics in memory and does not persist them across restarts. Use the --persistence.file command line flag to persist Pushgateway metrics across restarts.
./pushgateway --persistence.file=/tmp/pushgateway.metrics
With the persistence file option, Pushgateway will write the metrics to disk every 5 minutes. To change this, you can use the --persistence.interval configuration flag.
FAQ
What port does Pushgateway run on?
By default, Pushgateway runs on port 9091.
Does Pushgateway automatically expire metrics?
No. Pushgateway does not support a TTL or expiring metrics. Deleting metrics must be done via the DELETE API request.
Does Pushgateway support distributed counters?
No. Pushgateway only stores the latest value of each metric that was pushed to it.
If you need aggregation or distributed counters for ephemeral jobs, consider: https://github.com/zapier/prom-aggregation-gateway