Series Selection
What is a Vector?
A set of related time series is called a vector.
Types of Vectors
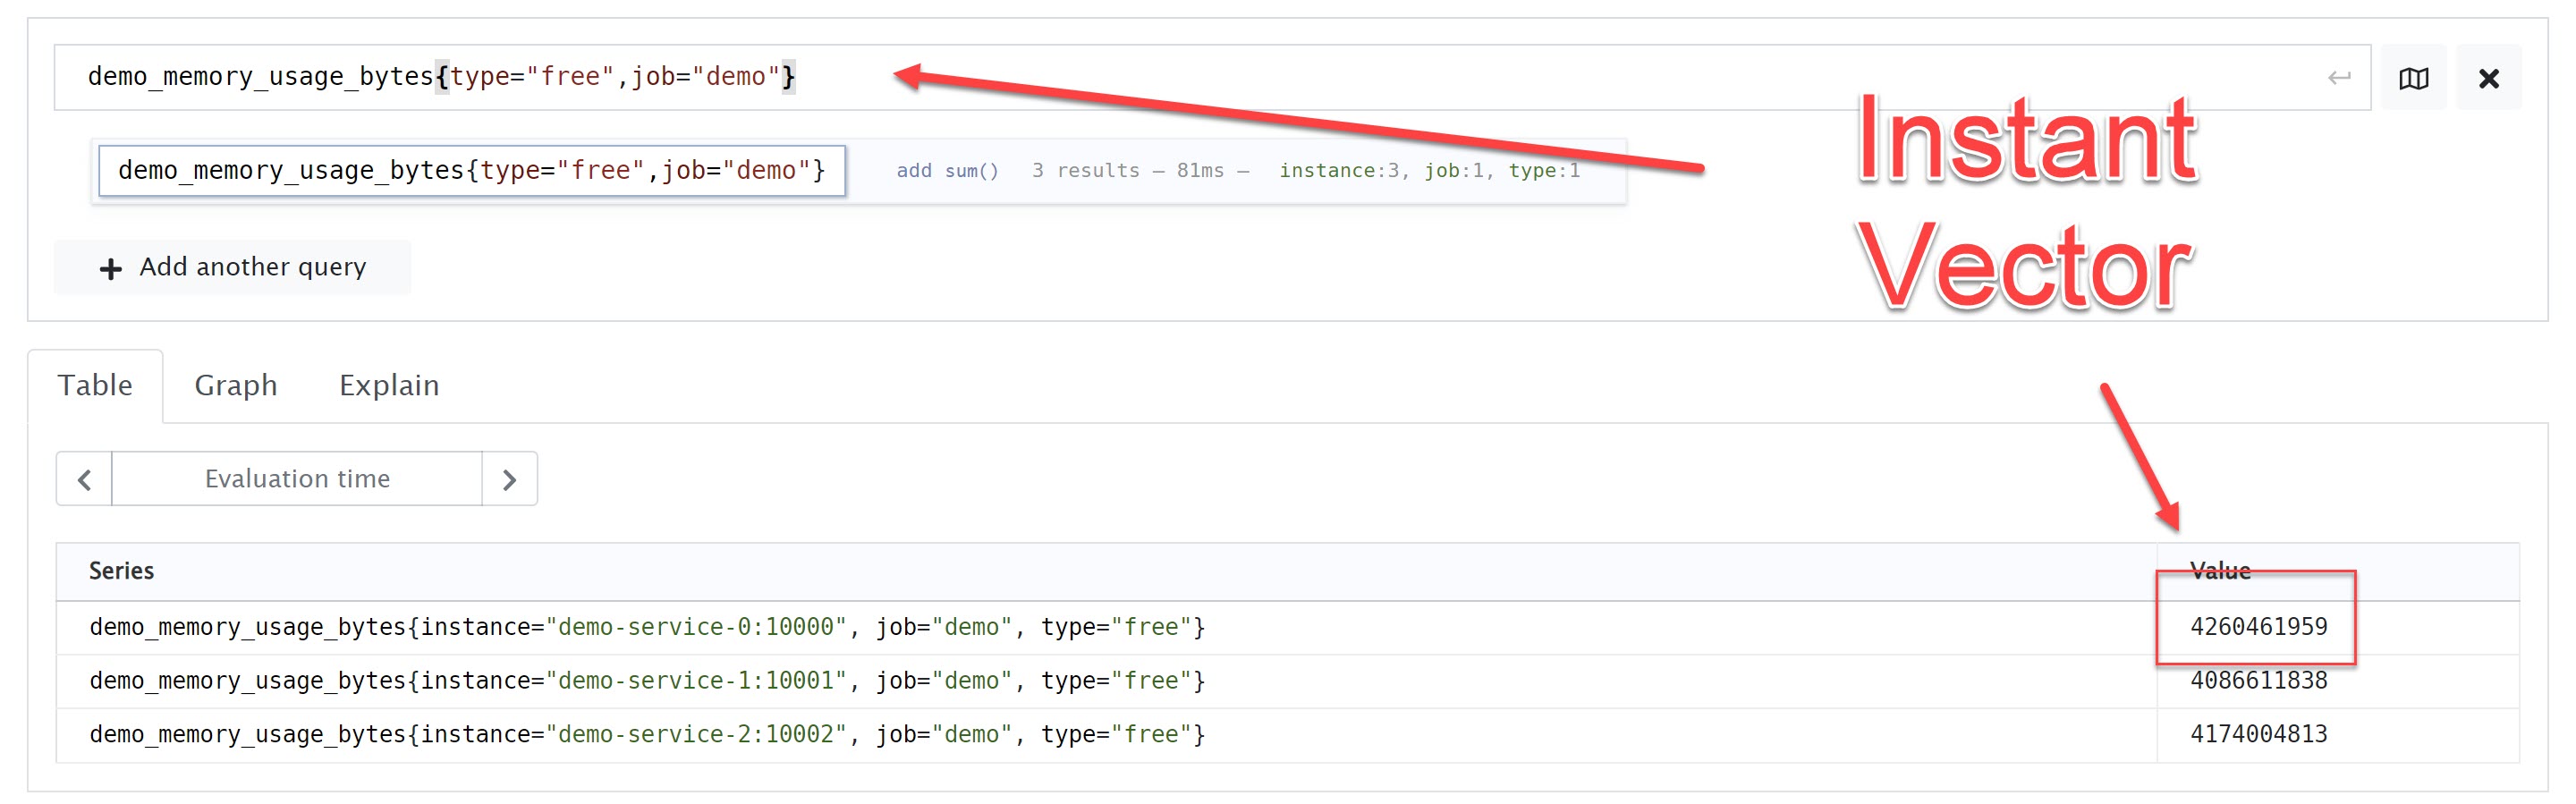
Instant Vector
Instant Vector - a set of time series where every timestamp maps to a single data point at that “instant”.
Imagine evaluating the expression http_requests_total at a given timestamp. http_requests_total is an instant vector selector that selects the "latest sample" for any time series with the metric name http_requests_total. More specifically, "latest" means "at most 5 minutes old and not stale", relative to the evaluation timestamp. So this selector will only yield a result for series that have a sample at most 5 minutes before the evaluation timestamp and where the last sample before the evaluation timestamp is not a stale marker (an explicit way of marking a series as terminating at a certain time in the Prometheus TSDB).
Instant Vector
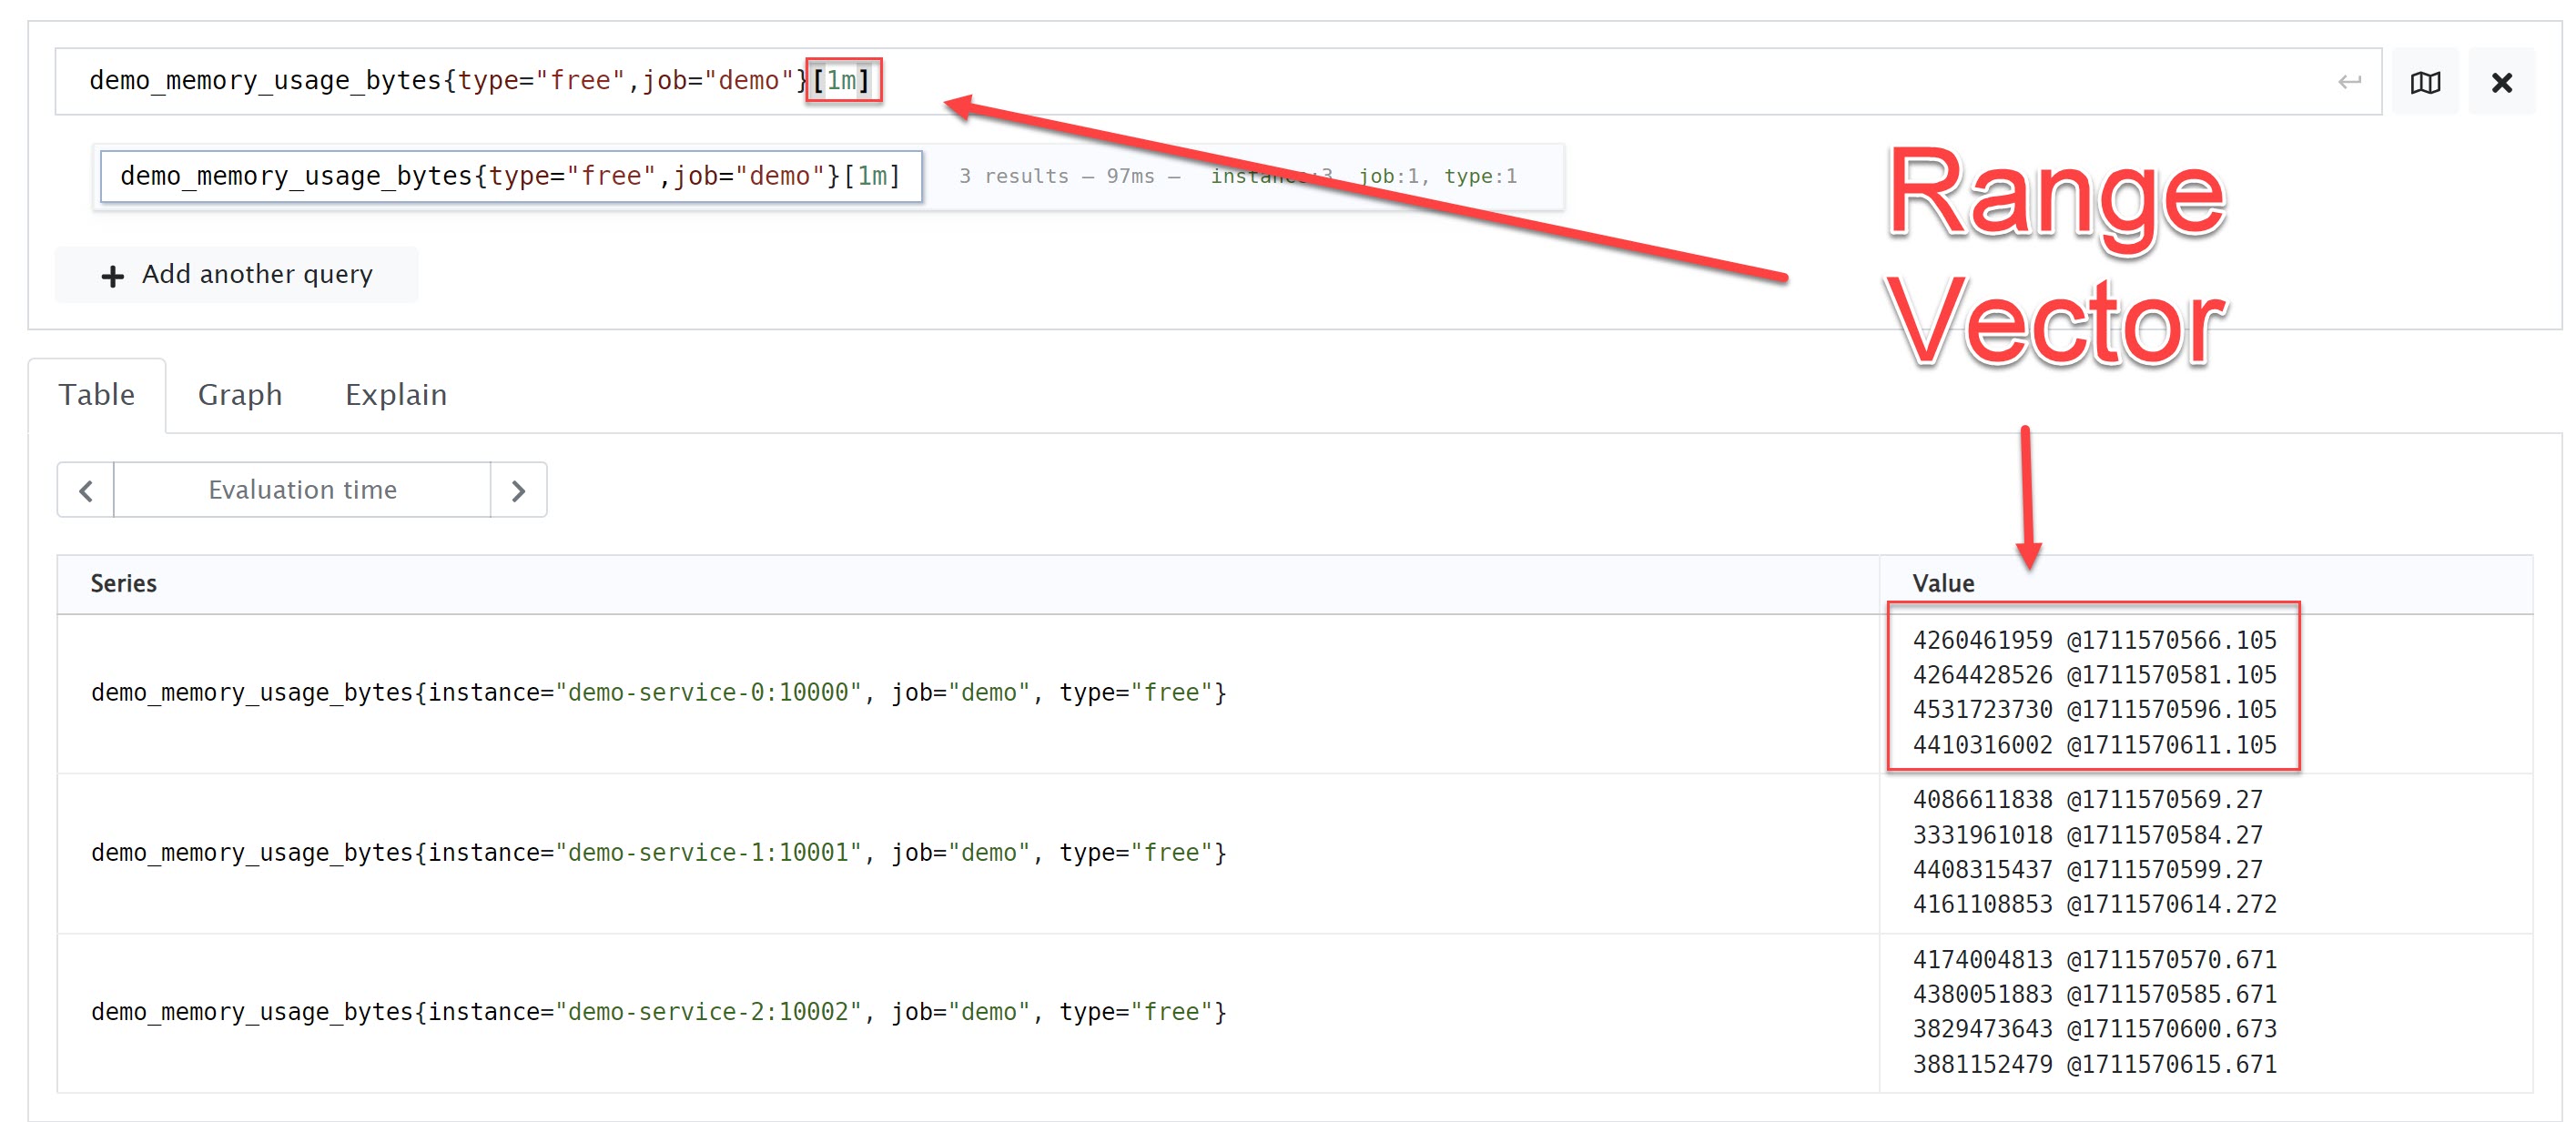
Range Vector
Range vector - a set of time series in which every timestamp maps to a “range” of data points recorded some duration into the past.
A range query works exactly like many completely independent instant queries that are evaluated at subsequent time steps over a given range of time. Of course, this is highly optimized under the hood, and Prometheus doesn't actually run many independent instant queries.
For example, http_requests_total[5m] would return all the data points falling in a 5-minute window at the evaluation timestamp.
Range Vector
Instant Vector vs Range Vector
- Instant vectors can be graphed, but range vectors cannot.
- Instant vectors can be compared, and arithmetic operations can be performed on them, but range vectors cannot.
Selecting Series
Select a Range of Time
You can change any instant vector selector into a range vector selector by appending a duration specifier [<number><unit>] . For example, [5m] for a 5-minute range.
Valid duration units:
ms- millisecondss- secondsm- minutesh- hoursd- daysy- years
Filter by Label
Matcher Types:
=: Equals!=: Not Equals=~: Regular Expression Match!~: Regular Expression Not Match
The following example would select all the metrics with the name "http_requests_total" that have a job label matching exactly demo and a path label starting with /api.
http_requests_total{path=~"/api.*",job="demo"}
Regular expression matches are fully anchored. A match of path=~"/api" is treated as env=~"^/api$". You can test your regex matches here using the Golang flavor.
Metric Names are Actually a Label
Did you know that the metric names in Prometheus are actually stored as labels? The __name__ label actually stores the metric name. This can be useful when trying to dynamically match metric names.