AWS CloudWatch
| Company | Estimated Time | Vendor Docs | Open Source |
|---|---|---|---|
| Amazon Web Services | 15 minutes | view | v3.rb |
What is AWS CloudWatch?
AWS CloudWatch provides monitoring for Amazon Web Services (AWS) and the applications that run on AWS. CloudWatch metrics play a critical role in the monitoring of the applications running on AWS cloud. A CloudWatch alarm can watch a single metric over a specified time period and execute automated actions based on the value of the watched metric and given threshold.
How It Works
AWS CloudWatch triggers user defined alarms by watching metrics.
- When an alarm is triggered (
ALARMstate) in AWS CloudWatch, an alert is created in PagerTree automatically. - When the alarm is closed (
OKstate) in AWS CloudWatch, the alert is resolved in PagerTree automatically.
Integration Walkthrough
In this integration tutorial we will show you how to send alarms from AWS CloudWatch to AWS Simple Notification Service (SNS) into PagerTree. The estimated time for this integration is 15 minutes. We assume that you already have a PagerTree and AWS account setup.
In PagerTree
- Create the integration by clicking the Amazon Web Services logo.
- Copy the Endpoint URL.
In AWS SNS Console
-
In the SNS Console, click “Create Topic”.
 (3)-ad41015077d86e7f2f453845baba635a.png)
In the AWS SNS console, click create topic.
-
Enter a Topic name (ex: “pagertree_integration”) and a Display name (ex: “pagertree”), then click “Create Topic”.
 (1)-e2529c80d06cbc1098a1fc9734c80161.png)
New SNS topic form.
-
Now that your topic has been created, click “Create Subscription”.
 (3) (1)-742afc97892d8c68a554f020cbcfd5ea.png)
Click create subscription button.
-
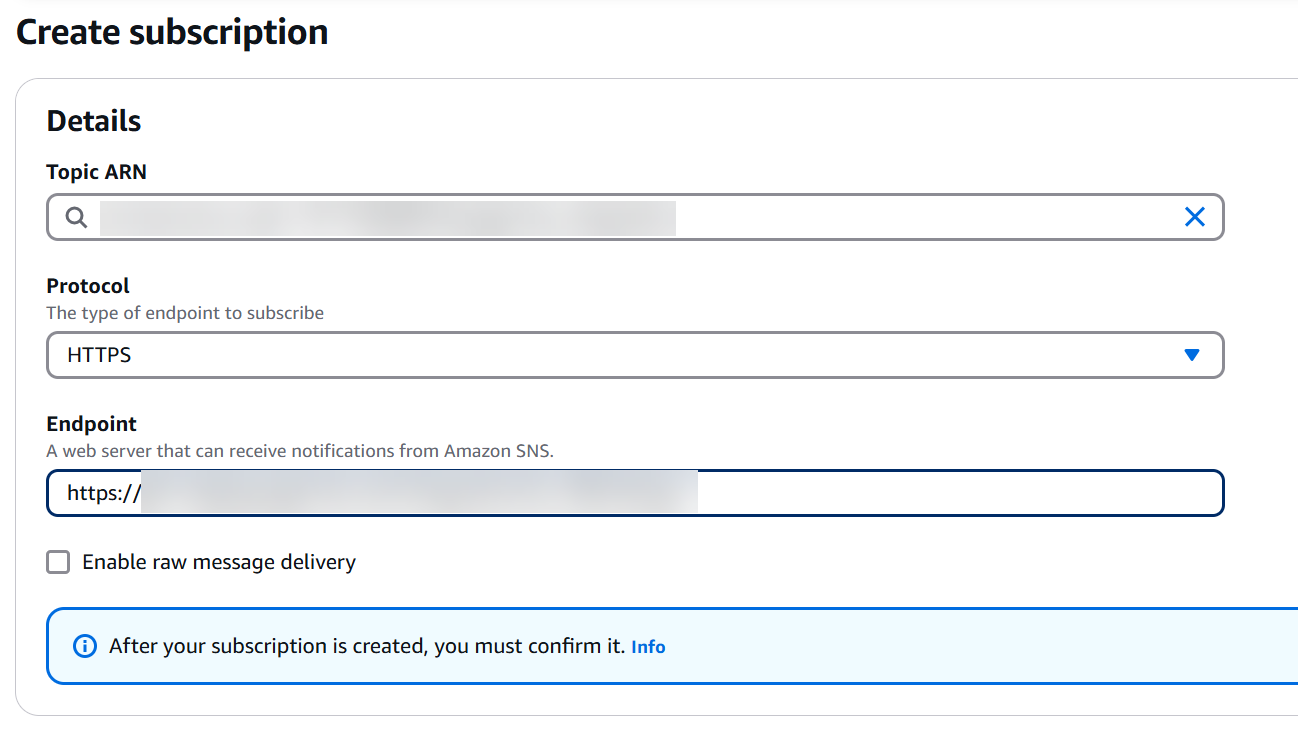
Select HTTPS as the Protocol and paste the PagerTree Endpoint URL as the Endpoint. Ensure the "Enable raw message delivery" is disabled.

Select the HTTPS protocol and paste your PagerTree endpoint URL.
-
Your subscription should be automatically confirmed. Click the refresh icon and ensure the Subscription ID is notPendingConfirmation.
 (2)-237ac08007b8e8007ffc78a583c8d7ed.png)
The subscription will automatically be confirmed by PagerTree.
In AWS EC2 Console
-
Go to your EC2 Instances Console. Right click on the instance that you would like to monitor, and select CloudWatch Monitoring -> Add/Edit Alarms.
 (1)-a7a00b8e467aa8cfb0b7b18165b5a645.png)
Add an alarm to an EC2 instance.
-
Click Create Alarm.
 (1)-8f8e9fc2f11710ab8119d2a52922de90.png)
Click the create alarm button.
-
Select your new notification topic from the drop down menu, configure the settings that would like to trigger the alarm, and click “Create Alarm”.
 (2)-0c6fc21134ce252ca9f81c19a70a7c87.png)
Select your newly created SNS Topic as the alarm destination.
-
At this point you PagerTree will create an alert if the alarm fires. To configure auto-resolve click the Alarm Link in the dialog box.
 (2)-10a1117c9e3f453fb6f9a5e9ba9ded7b.png)
In the success box click the CloudWatch alarm link.
-
With the new alarm selected, click Actions -> Modify.
 (1) (1)-6409d885360f7cc2cfeb4e00393725a5.png)
Modify your newly created CloudWatch alarm.
-
In the Actions section of the Modify Alarm window, click “+ Notification”.
 (2) (2) (1) (1)-d129a3330b1175bd8c81f2721a175a96.png)
Click the + Notification button.
-
Select the following values
- Whenever this alarm: State is OK
- Send notification to: your new notification topic
-
Click “Save Changes”.
 (2) (1) (2)-7e0d329a1b6bdcbc820d8fe5d4569804.png)
Modify the alarm to send OK messages to PagerTree.
You have successfully completed the AWS Cloudwatch integration.
Integration Templates
By default, the AWS CloudWatch integration sends the webhook in text format. PagerTree simplifies the parsing of the text and JSON for you in-case you want to use the integration templates.
Example Templates
Title Template Example
Notice the use of triple-stash {{{triple_stash}}} to allow HTML markup.
Description Template Example
Notice the use of the <pre> HTML tag to preserve formatting and line breaks. Also, notice how we use {{#with}} to create a new context for easier access to the data.
Use with Routers
You can use the AWS CloudWatch integration with Routers to customize how alerts are handled based on specific criteria. For example, you can route alerts to different teams based on the AWS account ID or the alarm name.
Example Router Conditions
---
rules:
  - match:
      log.data.Message.AWSAccountId: "account-id-123456789012"
    actions:
      - type: setval
        map:
          tags:
            - CustomerA
      - type: assign
        receiver: tem_xxxxxx1
  - match:
      log.data.Message.AlarmName: "Production-High-CPU-Alarm"
    actions:
      - type: setval
        map:
          tags:
            - DevOps
      - type: assign
        receiver: tem_xxxxxx2